Section 07. CapabilityContinuous
07. CapabilityContinuousOverviewEarly in any project (in Define for goal setting or more formally in Measure) it is crucial to understand the current level of performance of the process prior to making any changes. Many Champions and Belts mistakenly believe this is purely to show how much the project saves or how big an improvement is made to justify continuation of the Lean Sigma program. These things are important but are only a small piece of the picture. The primary use of the measure is to ensure the gains are sustained after the improvements are in place. If the change is unmeasured, it often is undone later (with all the best intentions) because it is not fully understood. However, if a measured and verified performance change is made, then there is less likelihood for future damaging "tweaks." There are many performance metrics available; for example throughput, OEE, quality, and so on, are typically represented as single numbers based on conformance to some goal. A better performance metric is to look at performance versus a specification(s), known as Capability.[10]
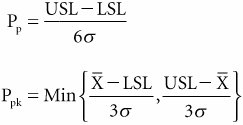
The simplest form of Capability for continuous data is known as Cp and is calculated as the ratio of the specification range divided by the process width: where:
The process width denominator is chosen as 6 standard deviations because this is deemed to a reasonable representation of the width of the process.[11]
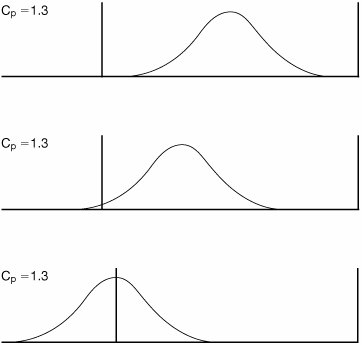
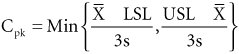
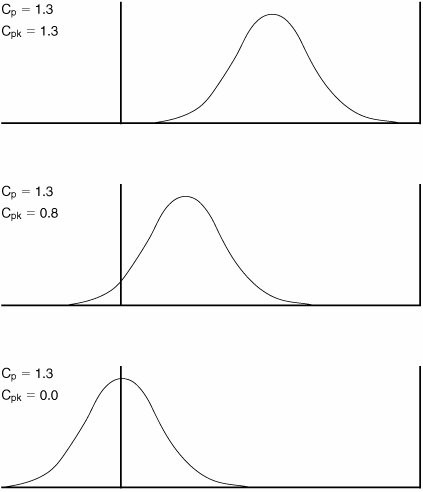
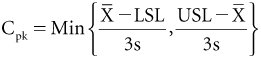
Cp suffers from one obvious flaw as depicted in Figure 7.07.1; it doesn't take into account the centering of the process. Figure 7.07.1 shows 3 graphs with same Cp but different process centering. Figure 7.07.1. The effect of process centering on Cp. A second metric needs to be introduced to counter this; known as Cpk, it is defined as Cpk represents the distance of the center of the process to the nearest specification limit in units of process width (in fact it is half the width because only one side of the process curve is considered at a time). Cpk is positive when the mean of the process is inside the specifications; it drops to zero as the mean hits the USL or LSL. In fact, it becomes negative as the process mean moves outside the specification range, as shown in Figure 7.07.2. Figure 7.07.2. The effect of process centering on Cp and Cpk. RoadmapThe roadmap to calculating the Capability for continuous data is as follows:
Interpreting the OutputExample output for a Capability Study is shown in Figure 7.07.3. The key metrics to focus on are
Capability (expressed as Cp and Cpk) is intended to represent short-term behavior of the process. In reality processes tend to shift and drift over time; the variation stays reasonably consistent, but the mean moves to and fro.[12] Taking this into account, the longer-term variation is actually larger than short-term and so the "capability" is lower in the long term than the short. Long-term "capability" is known as Performance and the equations are identical to those for Capability (short-term), but a longer-term standard deviation (σ instead of s) is used
Most software packages try to emulate this short-term versus long-term standard deviation by measuring it in two different ways; for long-term the regular standard deviation of all the data is used and for short-term the value comes from an equation involving the Moving Average across the data. In Figure 7.07.3, the within standard deviation represents short term and the overall standard deviation represents long term. The within value is used to calculate the Cp and Cpk, whereas the overall value is used to calculate the Pp and Ppk. Figure 7.07.3. An example of a Capability Study (output from Minitab v14).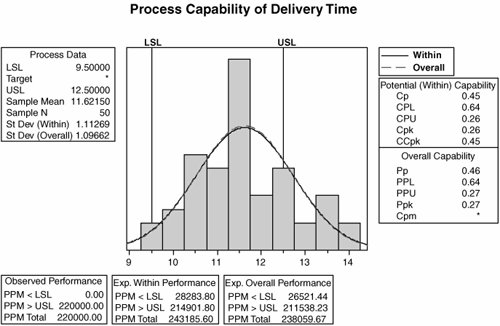 The target value for Cp in Lean Sigma is 2.0 and for Ppk it is 1.5. These are not absolute requirements in any way, but if a process exhibits Capability at this level then it can be considered to be performing very well. At the bottom of Figure 7.07.3 are boxes explaining likely performance of the process in terms of Parts per Million defective (PPM):
Of course, all the values are calculated from the sample of data taken. If a subsequent sample were taken, it is almost certain that different answers will arise; thus, it is inappropriate to quote PPMs to anything more than two or possibly three significant figures. Belts often take great delight in including numbers in reports to many decimal places, which is acceptable provided that they realize that the numbers will be different next time. Other OptionsThere are a number of variants to the preceding (standard) approach to calculating Capability that generally depend on the shape of the data and the behavior of the specification limits. Non-Normal DataAs mentioned in the Roadmap, normality of the data is a key consideration and is often a potential failure point for Belts. If the data are non-normally distributed, for example they are skewed to one side, then the Cp calculated is fallacious and could be misleading to the Belt. If the data is non-normal and unimodal (just one hump in the distribution), then the situation can be remedied by transforming the data. If the data is multimodal (more than one hump), it is likely that the process is unstable and hopefully there are simple special causes that can be identified and eliminated. Remember that in process improvement, a poor process is best seen as a big opportunity. The approach of transforming data is not dealt with here, but there are a number of transformations available in most statistics software packages, such as Box-Cox or Johnson. In fact in the more user-friendly statistical software packages there are specific non-normal Cp tool options.[13]
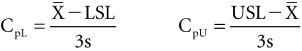
Single-Sided SpecificationsMany processes have both an Upper Specification Limit (USL) and a Lower Specification Limit (LSL); some have just one of these. For example, a metric, such as strength, might have an LSL in that there is a minimum strength to be considered acceptable by the Customer, but a USL doesn't make sense. In these cases, the Cp is no longer available as a metric because both specifications are required to calculate it: Instead the Cpk is more appropriate: For a single-sided specification, only half of the Cpk equation makes sense, so new metrics, known as Cp(upper) and Cp(lower), are used The same rules apply to CpU and CpL as they do to Cpk. The target value is 1.5 or above. If the mean of the data lies on the specification limit, then the associated value of CpU or CpL is zero. If the mean is outside of the specification, then the CpU or CpL is negative. BoundsFor some processes a lower or upper bound exists on the performance metric, for example:
In this case, the bound cannot be considered to be a specification limit, so the same approach is used here as is used for a single-sided specification and the bound is effectively omitted. Any predicted points below a Lower Bound are ignored, as are any above an Upper Bound. |
EAN: 2147483647
Pages: 138