S. Inventory Is Too High Overview Virtually all processes need standard levels of inventory of some sort along the process so that they can meet the delivery requirements of the downstream Customer. This is usually because the Process Lead Time is too long and thus when a trigger is received from the Customer to deliver an entity, there isn't enough time for the entity to traverse the whole process (see Figure 3.1). For more details see "TimeProcess Lead Time" and "TimeReplenishment Time" in Chapter 7, "Tools." Figure 3.1. Replenishment Time versus Process Lead Time 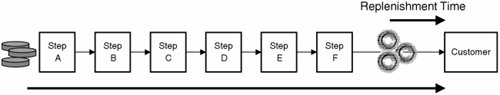
Other reasons for inventory might include the use of inventory in front of a bottleneck process step to ensure that the bottleneck is never starved of something to work on (time lost on the bottleneck is time lost forever for the whole process). Also, for "supply chain" reasons, we keep a stock of inventory at the beginning and end of the process (often known as Raw Materials and Finished Goods). We must look to understanding the Supply Chain to set the appropriate inventory levels.
Projects of this type usually take on three major forms: Rightsizing the inventory based on the existing process and replenishment requirements Understanding demand to reduce the need for inventory Making the process more responsive (shorter Process Lead Times) to reduce the need for elevated levels of inventory
Examples Industrial. Raw material, work in progress, finished goods inventory reduction Healthcare. Materials and supplies inventory Service/Transactional. Materials and supplies inventory, distribution center inventory levels
Measuring Performance Inventory can be measured in some interesting ways: Days On Hand (DOH). If my process uses 10Kg of raw materials per day and I have 80Kg, then I have 80Kg/10Kg=8 days of raw materials on hand. Inventory turns. If the cost of raw materials for sales made in one year is $1,000 and there is $200 of raw material inventory, that inventory will turn $1,000/$200=5 times in the year. Inventory dollars. The sum of the dollar cost of the inventory.
Although the reduction of the latter is most likely to be the end goal of a project of this sort, often DOH is a more enlightening metric because it gives a direct indication of validity of having the inventory. Tool Approach |  | For Days On Hand and Total Inventory Dollars, we will need to look at the validity of the metrics; a sound operational definition and consistent measure will be required. We will also need a Gage R&R on the metric if extensive gage-based counting or weigh counting is involved. For more details see "MSAValidity" and "MSAContinuous" in Chapter 7. | |  | Take a baseline measure of Days On Hand and Total Inventory Costs. It is highly likely that data is directly available and is fit for the purpose, unless our Gage R&R highlighted problems in the measurement system. |
As explained in the Overview, the solution can be based on three major areas: Rightsizing the inventory based on the existing process and replenishment requirements (internal adjustments to inventory management processes) Understanding demand in order to reduce the need for inventory (increased understanding of external realities) Making the process more responsive (shorter Process Lead Times) to reduce the need for elevated levels of inventory (changing internal operations processes in order to need less inventory)
Taking the first of these, rightsizing the inventory, can yield significant reductions just by setting the levels of inventory to the correct amount needed to run the process as follows: |  | Determine as a dollar value the levels of inventory for each entity type. Clearly the focus in the early stages should be on reducing the highest dollar value types. | |  | Starting at the top of the Pareto, calculate from the average daily usage of an entity type and the volume on hand of each entity type the Days On Hand of the inventory per item. |
At this point, there can be an immediate improvement made by simply setting a rational limit (beyond which it makes no sense to carry the inventory, for example, 90 days). Inventories beyond this level should be worked down immediately or dealt with appropriately. |  | Use Demand Segmentation to separate the high-volume, low-variation entity types from the low-volume, high-variation entity types. These can be dealt with differently. | |  | High-volume, low-variation entity types are effectively the low-risk inventory. By examining the Replenishment Time from the supplying processes, it will be possible to reduce the Days On Hand of these types even further. Set Reorder Points and Economic Order Quantities[14] based on daily usage and Replenishment Time for these types. | |  | Low-volume, high-variation entity types are effectively higher risk inventory. They will need further examination to determine the correct Reorder Points and Economic Order Quantities. | |  | Starting with the highest-value items from the Pareto, work through the low-volume, high-variability types and plot a Demand Profile for each. The Demand Profile will show the minimum inventory required on hand at any point. From this, the Replenishment Time and the peak daily usage, calculate the Reorder Point and Economic Order Quantities. | |  | The preceding simple mechanisms will have identified significant levels of inventory needing to be worked off, made obsolete, or dealt with appropriately. Create an Action List to formalize this and begin to implement. | |  | The controls for inventory will be in Purchasing or Operations Planning, depending on where the inventory was located. Move to the Control tools in Chapter 5 with focus on preventing inventory levels moving from their prescribed levels. |
[14] For details on Reorder Points and Economic Order Quantities, see for example Manufacturing Planning And Control Systems For Supply Chain Management, ISBN: 007144033X Publisher: McGraw-Hill Professional, Thomas E. Vollmann, William Lee Berry, David Clay Whybark, F. Robert Jacobs.
The preceding roadmap represents just the setting (usually reduction) of inventory to the correct levels. In fact, the true levels of inventory needed are determined by The ordering pattern of the entities The replenishment rate of the entities The time to replenish entities
These are driven entirely by the (internal) process generating the entities and the (external) process using the entities. In order to reduce inventories, we must tackle these processes, rather than the inventory management process. |  | The inventory level is too high because the variation in demand from the Customer is too high. In this case, go to Section I in this chapter. | |  | The inventory level is too high because, on average, the process can keep up, but the capacity is too low if a surge in demand appears. In this case, go to Section B in this chapter. | |  | The inventory level is too high because the time to replenish an entity (the Process Lead Time) is too long. In this case, go to Section G in this chapter. |
|