L. Measurement System Broken Overview It is a regular occurrence in businesses (and especially true in Service/Transactional processes) to find that a key measurement system that is relied upon to judge whether an entity is within specification or is just not up to par. The impact of this can be huge because the process might be delivering defective entities to the Customer and reworking good ones based on an unsound measurement. Usually this is a subproject discovered by a larger project looking at the operations process itself. Nevertheless, it can yield significant results in its own right. Examples Industrial. Production gages used to judge final quality Healthcare. Charging, triage Service/Transactional. Quoting accurately, weighing product
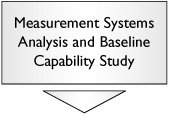
Measuring Performance Performance of a measurement system is built around the metrics used in Measurement Systems Analysis, namely % R&R, P/T Ratio, Repeatability, Reproducibility, and Distinct Categories. Notice that this list only contains the MSA metrics for continuous metrics (see "MSAContinuous" and "KPOVs and Data" in Chapter 7, "Tools"). There are attribute metric equivalents, but in general attribute measurement systems are usually limited at best for this type of use. Strive very hard in the early stages of the project to identify a related continuous metric that can replace the attribute metric. This will pay off in dividends later. If there seems to be no continuous metrics available (despite considerable effort by the Team looking for themhopefully, you are catching on to the hints here because they are being laid on quite thick), all is not lost. Proceed using this roadmap, but replace the Gage R&R analysis used with a Kappa study or Attribute MSA (see "MSAAttribute" in Chapter 7). Tool Approach In most roadmaps, in order to judge process performance (capability), an MSA is conducted first. Here the MSA is the Capability Study: |  | For continuous data, the Capability Study is the Gage R&R and the measures of capability will be % R&R, P/T Ratio, and Number of Distinct Categories. Use the method described in "MSAContinuous" in Chapter 7. For attribute data, the Capability Study is a Kappa Study (for classification) or Attribute MSA (for measurement), and the measures of capability will be Kappa or Percentage Agreement (within and between appraisers). See "MSAAttribute" in Chapter 7. | |  | Remember that a measurement system isn't just the gage that's used within it. This problem can be treated as its own process improvement project, where the measurement process is the focus. The defect reduction roadmap using Y=f(X1,..., Xn) works well. Consider the Ys to be Repeatability, Reproducibility, and Linearity (and possibly Discrimination). For reproducibility and repeatability, allocate the weighting in the C&E Matrix based on the % contribution from the Gage R&R Study (if high reproducibility, weight that higher). If the Gage (or metric) needs to perform over a broad range of values, give Linearity a high weighting. Go to Section C in this chapter. |
Other Considerations Sometimes there are limits to the measurement system that prevent it from having the precision required. Following the preceding roadmap might only get the system to be borderline acceptable. In this instance, it is possible to use a workaround known as a D-Study, which involves taking multiple readings and averaging them. Clearly this isn't the best scenario, but it could be the only practical path available short of investing in new measurement system technology. Improving measurement systems is a whole area of study in itself and involves complexities such as Destructive testing. The same entity cannot be measured twice (e.g., blood sample lab testing, chemical testing, test to failure, etc.). This makes the MSA very difficult because it requires a measure of multiple readings being made for the same entity.6 [7] [7] See Measurement Systems Analysis (3rd Edition) developed by the American Society for Quality and the Automotive Industry Action Group. See also Concepts for R&R Studies (2nd Edition) by Larry Barrentine (ASQ Quality Press, ISBN: 0873895576).
In-line testing. The test is done automatically within the process itself as the process proceeds. Therefore, there is no reproducibility element and, in fact, the test is akin to destructive testing because it is impossible to measure twice under exactly the same conditions.
There are solutions to examining these measurement systems such as Process variation studies. Using Nested ANOVA to understand the relative variation in test, sample, operator, batch, process, time, and so on.[8] [8] For an example, see Statistics for Experimenters: Design, Innovation, and Discovery, 2nd Edition (Wiley-Interscience, ISBN: 0471718130), pp. 571-583.
Reference materials. When using a gage to measure something highly variable (again, difficult to replicate a test), use a more consistent material with similar properties as a reference material to validate the gage.[9] [9] See the shingle testing study presented in Quality Engineering Magazine, 1998; article: "Using Repeatability and Reproducibility Studies to Evaluate a Destructive Measurement Test Method,", Quality Engineering, Vol. 10, No.2, December 1997, pp. 283-290 by Phillips, Aaron R; Jeffries, Rella; Schneider, Jan; Frankoski, Stanley P.
Each of these areas requires significant explanation and will not be discussed further here. |

