Section 44. Swimlane Map
44. Swimlane MapOverviewThe Swimlane Map is actually two different forms of maps, more formally known as the Cross-Functional Map and the Cross-Resource Map. Both are a simple extension of the detailed Value Stream Map (VSM) and are created from it.[85]
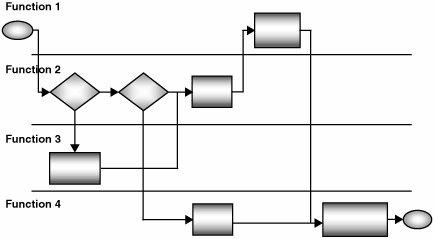
The simpler of the two, the Cross-Functional Map, is one that conveys process hand-offs between functions or departments, by rearranging VSM process steps into lanes of functions. The lanes run horizontally (or sometimes vertically) and the rows (or columns if vertically oriented) represent different functions in the business. Therefore, all activities from a particular function fall in appropriate swimlanes as they are known. Time runs along the horizontal axis of the Swimlane Map; thus, any concurrent activities appear vertically aligned with one-another. An example of the structure is shown in Figure 7.44.1. Figure 7.44.1. Cross-Functional Map Structure. The Cross-Resource Map is an extension to the Cross-Functional Map and takes the level of detail in the lanes one step lower. Where appropriate, Function Lanes are broken down to become individual Resource lanes. This is only appropriate where a specific Resource (a role, not a person) is always solely responsible for doing a particular task or activity. Functions that use pooled resources (anybody in that Function can pick up the task) are not split. An example of the structure is shown in Figure 7.44.2. It is unlikely in a Cross-Resource Map to see every single Function Lane broken down to the resource level, so the map is more of a hybrid than anything. Figure 7.44.2. Cross-Resource Map Structure.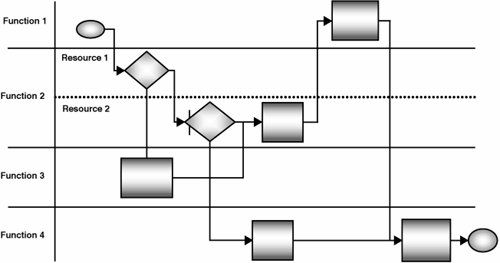 LogisticsThe Swimlane Map (either Cross-Function or Cross-Resource) is a quite a simple extension of the detailed VSM. It certainly requires the whole Team to construct it and should not be attempted by the Belt alone. Constructing the Swimlane Map from the VSM can take 30 minutes to an hour (depending on the size an complexity of the map) and can be done using the same sticky notes and repositioning them. It can, in theory, be done directly after the VSM is complete, but it is important to make sure the VSM is captured in electronic form first, so it is usually best to create the Swimlane Map at the next Team meeting to allow some transcription time to get the VSM into a flowcharting software package. As with the VSM, it is best to create the Swimlane Map as a Team by hand using sticky notes versus having one person entering the Map directly into software as the Team looks at the projected image on the wall. The latter approach tends to lead to the Team disengaging and errors creeping in. RoadmapThe roadmap to converting the detailed VSM into a Swimlane Map is as follows:
Figure 7.44.3. Section of a completed example Swimlane Map for order processing.[86]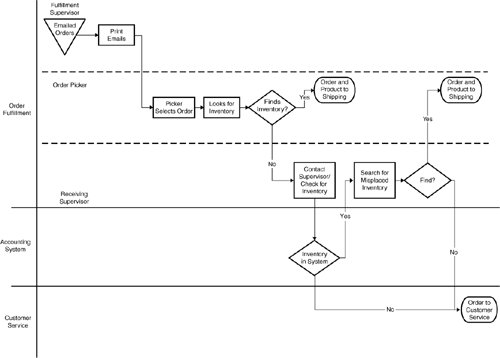
Interpreting the OutputThe Swimlane Map should be understandable to anyone looking at it, even for the first time. The key value that the Map brings is to understand
Other OptionsBoth the VSM and Swimlane Map bring large value in understanding to the project. Sometimes Teams can combine the two maps to create a hybrid VSM-Swimlane Map. This is a strange beast, but can be useful to represent everything on a single Map. The simplest way to construct the map is to actually construct the Swimlane Map from the VSM as before and then add a separate Swimlane on the Map (at either the very top or bottom) for the Primary Entity activity. There are no line connections to the other lanes, but the activities in those lanes are aligned chronologically based on the activities in the Value Stream, see Figure 7.44.4. The Map is useful because it shows who does what activity during the delays along the Value Stream, where and why the Primary Entity it stalled. Figure 7.44.4. Structure of a hybrid VSM-Swimlane Map.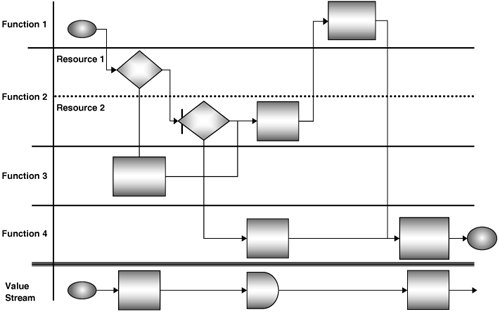 |
EAN: 2147483647
Pages: 138
- Structures, Processes and Relational Mechanisms for IT Governance
- An Emerging Strategy for E-Business IT Governance
- Linking the IT Balanced Scorecard to the Business Objectives at a Major Canadian Financial Group
- The Evolution of IT Governance at NB Power
- Governance Structures for IT in the Health Care Industry