Debugging in Visual Studio
When programs are run in debug mode, there is more going on than simply the code you have written being executed. Debug builds maintain symbolic information about your application, so that VS is capable of knowing exactly what is happening as each line of code is executed. Symbolic information means keeping track of, for example, the names of variables used in uncompiled code, so that they can be matched up to the values that exist in the compiled machine code application, which won't contain such human-readable information. This information is contained in .pdb files, which you may have seen appearing in Debug directories on your computer. This enables you to perform many useful operations, which include:
-
Outputting debugging information to VS
-
Looking at (and editing) the values of variables in scope during application execution
-
Pausing and restarting program execution
-
Automatically halting execution at certain points in the code
-
Stepping through program execution a line at a time
-
Monitoring changes in variable content during application execution
-
Modifying variable content at runtime
-
Performing test calls of functions
In this section, you take a look at these techniques and how you can use them to identify and fix those areas of code that do not work as expected, a process more commonly known as debugging.
I divide the techniques into two sections by the way they are used. In general, debugging is performed either by interrupting program execution or by making notes for later analysis. In VS terms, an application is either running or is in Break mode, that is, normal execution is halted. You'll look at the Nonbreak mode (runtime or normal) techniques first.
Debugging in Nonbreak (Normal) Mode
One of the commands you've been using throughout this book is the Console.WriteLine() function that outputs text to the console. When you are developing applications, this function can come in handy for getting extra feedback on operations, for example:
Console.WriteLine("MyFunc() Function about to be called."); MyFunc ("Do something."); Console.WriteLine("MyFunc() Function execution completed.");
This code snippet shows how you can give extra information concerning a function called MyFunc().
Doing this is all very well but can make your console output a bit cluttered. As an alternative, you can output text to a separate location — the Output window in VS.
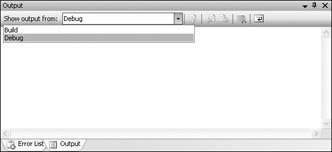
Back in Chapter 2, you saw the Error List window, and I mentioned that other windows could also be displayed in the same place. One of these windows, the Output window, can be very useful when it comes to debugging. To display this window, select View Output from the VS menu. With this window, you can see information relating to the compilation and execution of code, including errors encountered during compilation and so forth. You can also use this window to display custom diagnostic information by writing to it directly. This window is shown in Figure 7-1.

Figure 7-1
EAN: N/A
Pages: 278