| In this section we illustrate the application of MCMC signal processing (in particular, the Gibbs sampler) by treating three related problems in multiuser detection under a general Bayesian framework: (1) optimal multiuser detection in the presence of unknown channel parameters, (2) optimal multiuser detection in non-Gaussian ambient noise, and (3) multiuser detection in coded CDMA systems. The methods discussed in this section were first developed in [540]. We begin with a perspective on the related works in these three areas. The optimal multiuser detection algorithms with known channel parameters, that is, the multiuser maximum- likelihood sequence detector (MLSD) and the multiuser maximum a posteriori probability (MAP) detector, were first investigated in [517, 518] (cf. [520]). When the channel parameters (e.g., the received signal amplitudes and the noise variance) are unknown, it is of interest to study the problem of joint multiuser channel parameter estimation and data detection from the received waveform. This problem was first treated in [375], where a solution based on the expectation-maximization (EM) algorithm is derived. In [460], the problem of sequential multiuser amplitude estimation in the presence of unknown data is studied, and an approach based on stochastic approximation is proposed. In [581], a tree-search algorithm is given for joint data detection and amplitude estimation. Other works concerning multiuser detection with unknown channel parameters include [119, 206, 208, 326, 339, 464]. For systems employing channel coding, the optimal decoding scheme for convolutionally coded CDMA is studied in [143], which is shown to have a prohibitive computational complexity. In [144], some low-complexity receivers that perform multiuser symbol detection and decoding either separately or jointly are studied. The powerful turbo multiuser detection techniques for coded CDMA systems are discussed in Chapter 6. Finally, robust multiuser detection methods in non-Gaussian ambient noise CDMA systems are treated in Chapter 4. In what follows we present Bayesian multiuser detection techniques with unknown channel parameters in both Gaussian and non-Gaussian ambient noise channels. The Gibbs sampler is employed to calculate the Bayesian estimates of the unknown multiuser symbols from the received waveforms. The Bayesian multiuser detector can naturally be used in conjunction with the MAP channel decoding algorithm to accomplish turbo multiuser detection in unknown channels. Note that although in this section we treat only the simple synchronous CDMA signal model, the techniques discussed here can be generalized to treat more complicated systems, such as intersymbol-interference (ISI) channels [541], asynchronous CDMA with multipath fading [594], nonlinearly modulated CDMA systems [372], multicarrier CDMA systems with space-time coding [591], and systems with Gaussian minimum-shift-keying (GMSK) modulation over multipath fading channels [592]. 8.4.1 System Description As in Chapter 6, we consider a coded discrete-time synchronous real-valued baseband CDMA system with K users, employing normalized modulation waveforms s 1 , s 2 , ... s K , and signaling through a channel with additive white noise. The block diagram of the transmitter end of such a system is shown in Fig. 8.1. The binary information bits { d k [ n ]} n for user k are encoded using a channel code (e.g., block code, convolutional code, or turbo code). A code-bit interleaver is used to reduce the influence of the error bursts at the input of the channel decoder. The interleaved code bits are then mapped to BPSK symbols, yielding a symbol stream { b k [ i ]} i . Each data symbol is then modulated by a spreading waveform s k and transmitted through the channel. The received signal is the superposition of the K users' transmitted signals plus the ambient noise, given by Equation 8.17 
Figure 8.1. Coded synchronous CDMA communication system.  In (8.17), M is the number of data symbols per user per frame; A k , b k [ i ], and s k denote, respectively, the amplitude, the i th symbol, and the normalized spreading waveform of the k th user; and n [ i ] = [ n [ i ] n 1 [ i ] ... n N-1 [ i ]] T is a zero-mean white noise vector. The spreading waveform is of the form Equation 8.18 
where N is the spreading factor. It is assumed that the receiver knows the spreading waveforms of all active users in the system. Define the following a priori symbol probabilities: Equation 8.19 
Note that when no prior information is available, we choose r k [ i ] = ½ (i.e., all symbols are assumed to be equally likely). It is further assumed that the additive ambient channel noise { n [ i ]} is a sequence of zero-mean i.i.d. random vectors independent of the symbol sequences { b k [ i ]} i ;k . Moreover, each noise vector n [ i ] is assumed to consist of i.i.d. samples { n j [ i ]} j . Here we consider two types of noise distributions, corresponding to additive Gaussian noise and additive impulsive noise, respectively. For the former case, the noise n j [ i ] is of course assumed to have a Gaussian distribution: Equation 8.20 
where s 2 is the variance of the noise. For the latter case, the noise n j [ i ] is assumed to have a two- term Gaussian mixture distribution (cf. Chapter 4): Equation 8.21 
with 0 <  < 1 and < 1 and  < <  . Here the term N (0, . Here the term N (0,  ) represents the nominal ambient noise, and the term N (0, ) represents the nominal ambient noise, and the term N (0,  ) represents an impulsive component, with ) represents an impulsive component, with  representing the probability that an impulse occurs. The total noise variance under distribution (8.21) is given by representing the probability that an impulse occurs. The total noise variance under distribution (8.21) is given by Equation 8.22 
Denote  . We consider the problem of estimating the a posteriori probabilities of the transmitted symbols . We consider the problem of estimating the a posteriori probabilities of the transmitted symbols Equation 8.23 
based on the received signals Y and the prior information { r k [ i ] i ; k , without knowing the channel amplitudes { A k } and the noise parameters (i.e., s 2 for Gaussian noise;  , ,  , and , and  for non-Gaussian noise). These a posteriori probabilities are then used by the channel decoder to decode the information bits { d k [ n ]} n ; k shown in Fig. 8.1, which is discussed in Section 8.4.4. for non-Gaussian noise). These a posteriori probabilities are then used by the channel decoder to decode the information bits { d k [ n ]} n ; k shown in Fig. 8.1, which is discussed in Section 8.4.4. 8.4.2 Bayesian Multiuser Detection in Gaussian Noise We now consider the problem of computing the a posteriori probabilities in (8.23) under the assumption that the ambient noise distribution is Gaussian; that is, the pdf of n [ i ] in (8.17) is given by Equation 8.24 
Define the following notation: 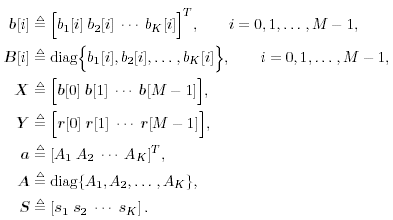 Then (8.17) can be written as Equation 8.25 
Equation 8.26 
We approach this problem using a Bayesian framework: First, the unknown quantities a , s 2 , and X are regarded as realizations of random variables with some prior distributions. The Gibbs sampler, a Monte Carlo method, is then employed to calculate the maximum a posteriori probability estimates of these unknowns. Bayesian Inference Assume that the unknown quantities a , s 2 , and X are independent of each other and have prior densities p ( a ), p ( s 2 ), and p ( X ), respectively. Since { n [ i ]} is a sequence of independent Gaussian vectors, using (8.24) and (8.25), the joint posterior density of these unknown quantities ( a , s 2 , X ) based on the received signal Y takes the form Equation 8.27 
The a posteriori probabilities (8.23) of the transmitted symbols can then be calculated from the joint posterior distribution (8.27) according to Equation 8.28 
The computation in (8.28) involves 2 KM -1 multidimensional integrals, which is clearly infeasible for any practical implementations with typical values of K and M . To avoid the direct evaluation of the Bayesian estimate (8.28), we resort to the Gibbs sampler discussed in Section 8.3. The basic idea is to generate ergodic random samples { a ( n ) , s 2 ( n ) , X ( n ) : n = n , n +1,...} from the posterior distribution (8.27), and then to average { b k [ i ] ( n ) : n = n , n +1,...} drawn from an appropriate conditional distribution to obtain an approximation of the a posteriori probabilities in (8.28). Prior Distributions In Bayesian analysis, prior distributions are used to incorporate the prior knowledge about the unknown parameters. When such prior knowledge is limited, the prior distributions should be chosen such that they have a minimal impact on the posterior distribution. Such priors are termed noninformative . The rationale for using noninformative prior distributions is to "let the data speak for themselves ," so that inferences are unaffected by information external to current data [51, 136, 248]. Another consideration in the selection of the prior distributions is to simplify computations . To that end, conjugate priors are generally used to obtain simple analytical forms for the resulting posterior distributions. The property that the posterior distribution belongs to the same distribution family as the prior distribution is called conjugacy . Conjugate families of distributions are mathematically convenient in that the posterior distribution follows a known parametric form [51, 136, 248]. Finally, to make the Gibbs sampler more computationally efficient, the priors should also be chosen such that the conditional posterior distributions are easy to simulate. Following these general guidelines in Bayesian analysis, we choose the conjugate prior distributions for the unknown parameters p ( a ), p ( s 2 ), and p ( X ), as follows. For the unknown amplitude vector a , a truncated Gaussian prior distribution is assumed, Equation 8.29 
where I { a > } is an indicator which is 1 if all elements of a are positive and is zero otherwise . Note that large values of S correspond to less informative priors. For the noise variances s 2 , an inverse chi-square prior distribution is assumed, Equation 8.30 
or Equation 8.31 
Small values of v correspond to the less informative priors ( roughly , the prior knowledge is worth v data points). The value of v l reflects the prior belief of the value of s 2 . Finally, since the symbols { b k [ i ]} i ;k are assumed to be independent, the prior distribution p ( X ) can be expressed in terms of the prior symbol probabilities defined in (8.19) as Equation 8.32 
where Equation 8.33 
Conditional Posterior Distributions The following conditional posterior distributions are required by the Gibbs multiuser detector in Gaussian noise. The derivations are given in the Appendix (Section 8.7.1). -
The conditional distribution of the amplitude vector a given s 2 , X , and Y is given by Equation 8.34 
with Equation 8.35 
Equation 8.36 
where, in (8.35), we have used  as usual to denote the cross-correlation matrix of the signaling set. as usual to denote the cross-correlation matrix of the signaling set. -
The conditional distribution of the noise variance s 2 given a, X , and Y is given by Equation 8.37 
or Equation 8.38 
with Equation 8.39 
-
The conditional probabilities of b k [i] = ±1, given a , s 2 , X ki , and Y can be obtained from (where  ) ) Equation 8.40 
where  Gibbs Multiuser Detector in Gaussian Noise Using the conditional posterior distributions above, the Gibbs sampling implementation of the Bayesian multiuser detector in Gaussian noise proceeds iteratively as follows. Algorithm 8.5: [Gibbs multiuser detector in Gaussian noise] Given initial values of the unknown quantities  drawn from their prior distributions, proceed as follows. For n = 1,2,...: drawn from their prior distributions, proceed as follows. For n = 1,2,...: -
Draw a (n) from p ( a s 2( n -1) , X ( n -1) , Y ) given by (8.34) . -
Draw s 2( n ) from p ( s 2 a ( n ) , X ( n -1) , Y ) given by (8.38) . -
For i = 0, 1, ..., M “1 For k = 1, 2, ..., K Draw  from P( from P(  ) given by (8.40) , ) given by (8.40) , where  Note that to draw samples of a from (8.29), or (8.34), the rejection method [527] can be used. For instance, after a sample is drawn from N ( a , S ) or N ( a * , S * ), check to see if the constraint A k > 0, k = 1, ..., K , is satisfied; if not, the sample is rejected and a new sample is drawn from the same distribution. The procedure continues until a sample is obtained that satisfies the constraint. To ensure convergence, the procedure above is usually carried out for ( n + N ) iterations for suitably chosen n and N , and samples from the last N iterations are used to calculate the Bayesian estimates of the unknown quantities. In particular, the a posteriori symbol probabilities in (8.28) are approximated as Equation 8.41 
where Equation 8.42 
A MAP decision on the symbol b k [ i ] is then given by Equation 8.43 
Furthermore, if desired, estimates of the amplitude vector a and the noise variance s 2 can also be obtained from the corresponding sample means: Equation 8.44 
Equation 8.45 
The posterior variances of a and s 2 , which reflect the uncertainty in estimating these quantities on the basis of Y , can also be approximated by the sample variances as Equation 8.46 
Equation 8.47 
Note that the computations above are exact in the limit as N   . However, since they involve only a finite number of samples, we think of them as approximations but realize that in theory any order of precision can be achieved given a sufficiently large sample size N . . However, since they involve only a finite number of samples, we think of them as approximations but realize that in theory any order of precision can be achieved given a sufficiently large sample size N . The complexity of the Gibbs multiuser detector above per iteration is  ( K 2 + KM ); that is, it has a term that is quadratic with respect to the number of users K , due to the inversion of the positive-definite symmetric matrix in (8.35), and a term that is linear with respect to the symbol block size M . The total complexity is then ( K 2 + KM ); that is, it has a term that is quadratic with respect to the number of users K , due to the inversion of the positive-definite symmetric matrix in (8.35), and a term that is linear with respect to the symbol block size M . The total complexity is then  [ K 2 + KM ) ( n + N )]. For practical values of K and M , this is a substantial complexity reduction compared with the direct implementation of the Bayesian symbol estimate (8.28), whose complexity is [ K 2 + KM ) ( n + N )]. For practical values of K and M , this is a substantial complexity reduction compared with the direct implementation of the Bayesian symbol estimate (8.28), whose complexity is  (2 KM ). (2 KM ). Simulation Examples We consider a five-user ( K = 5) synchronous CDMA channel with processing gain N = 10. The user spreading waveform matrix S and the corresponding correlation matrix R are given, respectively, by 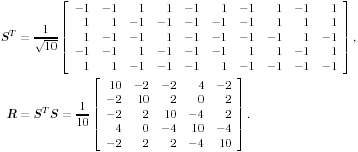 The following noninformative conjugate prior distributions are used in the Gibbs sampler for the case of Gaussian noise:  Note that the performance of the Gibbs sampler is insensitive to the values of the parameters in these priors as long as the priors are noninformative. We illustrate the convergence behavior of the Bayesian multiuser detector in Gaussian noise. In this example, the user amplitudes and the noise variance are taken to be  , ,  , ,  , ,  , ,  , and s 2 = -2 dB. The data block size of each user is M = 256. In Fig. 8.2 we plot the first 100 samples drawn by the Gibbs sampler of the parameters b 3 [50], b 4 [100], A 1 , A 5 , and s 2 . The corresponding true values of these quantities are shown in the same figure as horizontal lines. Note that in this case, the number of unknown parameters is K + KM + 1 = 1286 (i.e., a , X , and s 2 ). Remarkably, it is seen that the Gibbs sampler reaches convergence within about 20 iterations. The marginal posterior distributions of the unknown parameters A 1 , A 5 , and s 2 in the steady state can be illustrated by the corresponding histograms, which are also shown in Fig. 8.2. The histograms are based on 500 samples collected after the initial 50 iterations. , and s 2 = -2 dB. The data block size of each user is M = 256. In Fig. 8.2 we plot the first 100 samples drawn by the Gibbs sampler of the parameters b 3 [50], b 4 [100], A 1 , A 5 , and s 2 . The corresponding true values of these quantities are shown in the same figure as horizontal lines. Note that in this case, the number of unknown parameters is K + KM + 1 = 1286 (i.e., a , X , and s 2 ). Remarkably, it is seen that the Gibbs sampler reaches convergence within about 20 iterations. The marginal posterior distributions of the unknown parameters A 1 , A 5 , and s 2 in the steady state can be illustrated by the corresponding histograms, which are also shown in Fig. 8.2. The histograms are based on 500 samples collected after the initial 50 iterations. Figure 8.2. Samples and histograms: Gaussian noise.  , ,  , ,  , ,  , ,  , and s 2 = -2 dB. The histograms are based on 500 samples collected after the initial 50 iterations. , and s 2 = -2 dB. The histograms are based on 500 samples collected after the initial 50 iterations. 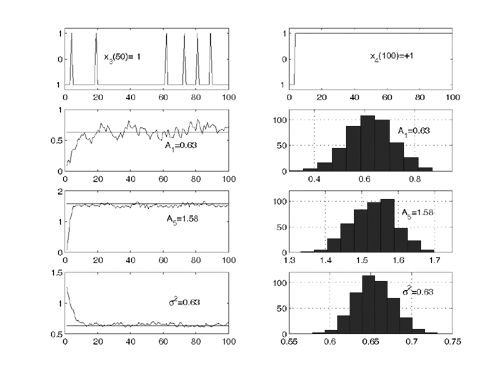 8.4.3 Bayesian Multiuser Detection in Impulsive Noise We next discuss Bayesian multiuser detection via the Gibbs sampler in non-Gaussian impulsive noise. As discussed above, it is assumed that the noise samples { n j [ i ]} j of n [ i ] in (8.17) are independent with a common two-term Gaussian mixture pdf given by Equation 8.48 
with 0 <  < 1 and < 1 and  . . Prior Distributions Define the following indicator random variable to indicate distribution of the noise sample n j [ i ]: Equation 8.49 
Denote  and and Equation 8.50 
The unknown quantities in this case are a ,  , ,  , ,  , I , and X . The joint posterior distribution of these unknown quantities based on the received signal Y takes the form , I , and X . The joint posterior distribution of these unknown quantities based on the received signal Y takes the form Equation 8.51 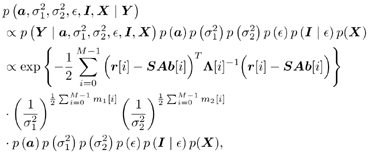
where m l [ i ] is the number of l 's in { I [ i ], I 1 [ i ],..., I N “1[ i ]}, l = 1, 2. Note that m 1 [ i ] + m 2 [ i ] = N . We next specify the conjugate prior distributions of the unknown quantities in (8.51). As in the case of Gaussian noise, the prior distributions p ( a ) and p ( X ) are given, respectively, by (8.29) and (8.32). For the noise variances  , l = 1,2, independent inverse chi-square distributions are assumed: , l = 1,2, independent inverse chi-square distributions are assumed: Equation 8.52 
For the impulse probability  , a beta prior distribution is assumed: , a beta prior distribution is assumed: Equation 8.53 
Note that the value a /( a + b ) reflects the prior knowledge of the value of  . Moreover, ( a + b ) reflects the strength of the prior belief [i.e., roughly the prior knowledge is worth ( a + b ) data points]. Given . Moreover, ( a + b ) reflects the strength of the prior belief [i.e., roughly the prior knowledge is worth ( a + b ) data points]. Given  , the conditional distribution of the indicator I j [ i ] is then , the conditional distribution of the indicator I j [ i ] is then Equation 8.54 
Equation 8.55 
with  Conditional Posterior Distributions The following conditional posterior distributions are required by the Gibbs multiuser detector in non-Gaussian noise. The derivations are given in the Appendix (Section 8.7.2). -
The conditional distribution of the amplitude vector a given  , ,  , ,  , I , X , and Y is given by , I , X , and Y is given by Equation 8.56 
with Equation 8.57 
Equation 8.58 
-
The conditional distribution of the noise variance  given a , given a ,  , ,  , I , X , and Y is given by [here , I , X , and Y is given by [here  if l = 1, and if l = 1, and  if l = 2] if l = 2] Equation 8.59 
with Equation 8.60 
In (8.60) 1 { I j [ i ] = l } is 1 if I j [ i ] = l and is 0 if I j [ i ]  l ; and l ; and  is the j th row of the spreading waveform matrix S , j = 0,..., N “ 1. is the j th row of the spreading waveform matrix S , j = 0,..., N “ 1. -
The conditional probability of b k [ i ] = ±1 given a ,  , ,  , ,  , Y , X ki , and Y can be obtained from (where , Y , X ki , and Y can be obtained from (where  ) ) Equation 8.61 
where  . . -
The conditional distribution of I j [ i ] given a ,  , ,  , ,  , I ji , X , and Y can be obtained from where ( , I ji , X , and Y can be obtained from where (  ) ) Equation 8.62 
-
The conditional distribution of  given a , given a ,  , ,  , I , X , and Y is given by , I , X , and Y is given by Equation 8.63 
Gibbs Multiuser Detector in Impulsive Noise Using the conditional posterior distributions above, the Gibbs sampling implementation of the Bayesian multiuser detector in impulsive noise proceeds iteratively as follows. Algorithm 8.6: [Gibbs multiuser detector in impulsive noise] Given initial values of the unknown quantities { a (0) ,  , ,  , ,  (0) , I (0) , X (0) } drawn from their prior distributions, proceed as follows. For n = 1, 2,...: (0) , I (0) , X (0) } drawn from their prior distributions, proceed as follows. For n = 1, 2,...: -
Draw a ( n ) from p (  , ,  , ,  ( n -1) , I ( n -1) , X ( n -1) , Y ) given by (8.56) . ( n -1) , I ( n -1) , X ( n -1) , Y ) given by (8.56) . -
Draw  from p( from p(  , ,  , ,  ( n -1) , I ( n -1) , X ( n -1) , Y ) given by (8.59); ( n -1) , I ( n -1) , X ( n -1) , Y ) given by (8.59); draw  from p ( from p (  , ,  , ,  ( n -1) , I ( n -1) , X ( n -1) , Y ) given by (8.59) . ( n -1) , I ( n -1) , X ( n -1) , Y ) given by (8.59) . -
For i = 0, 1, ..., M “ 1 For k = 1, 2, ..., K Draw  from from  given by (8.61), where given by (8.61), where  -
For i = 0, 1, ..., M “ 1 For j = 0, 1, ..., N “ 1 Draw  from P ( I j [ i ] a ( n ) , from P ( I j [ i ] a ( n ) ,  , ,  , ,  ( n -1) , ( n -1) ,  , X ( n ) , Y ) given by (8.62), where , X ( n ) , Y ) given by (8.62), where  -
Draw  ( n ) from p ( ( n ) from p (  a ( n ) , a ( n ) ,  , ,  , I ( n ) , X ( n ) , Y ) given by (8.63) . , I ( n ) , X ( n ) , Y ) given by (8.63) . As in the case of Gaussian noise, the a posteriori symbol probabilities P ( b k [ i ]= +1/ Y ) are computed using (8.41). The a posteriori means and variances of the other unknown quantities can be computed similar to (8.44) “(8.47). The complexity of the Gibbs multiuser detector above is  ( K 2 + KM + MN ) per iteration. Note that the direct implementation of the Bayesian symbol estimate based on (8.51) has a computational complexity of ( K 2 + KM + MN ) per iteration. Note that the direct implementation of the Bayesian symbol estimate based on (8.51) has a computational complexity of  (2 KM + MN ). (2 KM + MN ). Simulation Examples The simulated CDMA system is the same as that in Section 8.4.2, except that the noise samples are generated according to the two-term Gaussian model (8.21) with the parameters  The data block size of each user is M = 256. The following noninformative conjugate prior distributions are used in the Gibbs sampler:  The first 100 samples drawn by the Gibbs sampler of the parameters b 3 [100], I 5 [75], A 3 ,  , ,  , and , and  are shown in Fig. 8.3. The corresponding true values of these quantities are shown in the same figure as horizontal lines. Note that in this case, the number of unknown parameters is K + KM + NM + 3 = 3848 (i.e., a, X , I , are shown in Fig. 8.3. The corresponding true values of these quantities are shown in the same figure as horizontal lines. Note that in this case, the number of unknown parameters is K + KM + NM + 3 = 3848 (i.e., a, X , I ,  , ,  , and , and  )! It is seen that as in the Gaussian noise case, the Gibbs sampler converges within about 20 samples. The histograms of the unknown parameters A 3 , )! It is seen that as in the Gaussian noise case, the Gibbs sampler converges within about 20 samples. The histograms of the unknown parameters A 3 ,  , ,  , and , and  are also shown in Fig. 8.3, which are based on 500 samples collected after the initial 50 iterations. are also shown in Fig. 8.3, which are based on 500 samples collected after the initial 50 iterations. Figure 8.3. Samples and histograms: non-Gaussian noise.  , ,  , ,  , ,  , ,  , ,  =0.1, =0.1,  , ,  . The histograms are based on 500 samples collected after the initial 50 iterations. . The histograms are based on 500 samples collected after the initial 50 iterations. 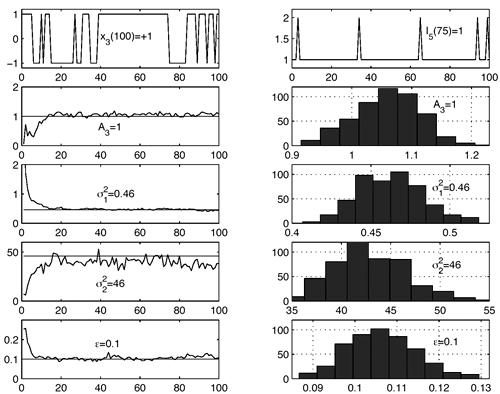 8.4.4 Bayesian Multiuser Detection in Coded Systems Turbo Multiuser Detection in Unknown Channels Because it utilizes a priori symbol probabilities and produces symbol (or bit) a posteriori probabilities, the Bayesian multiuser detector discussed in this section is well suited for iterative processing that allows the Bayesian multiuser detector to refine its processing based on the information from the decoding stage, and vice versa. In Chapter 6, turbo multiuser receivers are described for a number of systems under the assumption that the channels are known to the receiver. The Bayesian multiuser detectors discussed in Sections 8.4.2 and 8.4.3 make it possible to accomplish turbo multiuser detection in coded CDMA systems with unknown channels. The turbo receiver structure discussed in Section 6.3.1 is shown in Fig. 8.4. It consists of two stages: a Bayesian multiuser detector followed by K MAP channel decoders. The two stages are separated by deinterleavers and interleavers. The Bayesian multiuser detector delivers the a posteriori symbol probabilities { P ( b k [ i ] = +1 Y )} i;k . Based on these, we first compute the a posteriori log-likelihood ratios of a transmitted "+1" symbol and a transmitted "-1" symbol, Equation 8.64 
Figure 8.4. Turbo multiuser detection in unknown channels.  Using Bayes' formula, (8.64) can be written as Equation 8.65 
where the second term in (8.65), denoted by l 2 ( b k [ i ]), represents the a priori LLR of the code bit b k [ i ], which is computed by the channel decoder in the previous iteration, interleaved, and then fed back to the adaptive Bayesian multiuser detector. For the first iteration, assuming equally likely code bits (i.e., no prior information available), we then have l 2 ( b k [ i ]) = 0, k = 1, ..., K, i = 0, ..., M “ 1. The first term in (8.65), denoted by l 1 ( b k [ i ]), represents the extrinsic information delivered by the Bayesian multiuser detector, based on the received signals Y , the structure of the multiuser signal given by (8.17), and prior information about all other code bits. The extrinsic information l 1 ( b k [ i ]), which is not influenced by the a priori information l 2 ( b k [ i ]) provided by the channel decoder, is then reverse interleaved (we denote the deinterleaved code bit sequence of the k th user as {(  } i ) and fed into the channel decoder as the a priori information in the next iteration. } i ) and fed into the channel decoder as the a priori information in the next iteration. Based on the extrinsic information of the code bits { l 1 (  )} i and the structure of the channel code, the k th user's MAP channel decoder computes the a posteriori LLR of each code bit (see Section 6.2 for the MAP decoding algorithm): )} i and the structure of the channel code, the k th user's MAP channel decoder computes the a posteriori LLR of each code bit (see Section 6.2 for the MAP decoding algorithm): Equation 8.66 
It is seen from (8.66) that the output of the MAP channel decoder is the sum of the prior information l 1 (  ) and the extrinsic information l 2 ( ) and the extrinsic information l 2 (  ) delivered by the channel decoder. This extrinsic information is the information about the code bit ) delivered by the channel decoder. This extrinsic information is the information about the code bit  gleaned from the prior information about the other code bits, { gleaned from the prior information about the other code bits, {  } l } l  i , based on the constraint structure of the code. The MAP channel decoder also computes the a posteriori LLR of every information bit, which is used to make a decision on the decoded bit at the last iteration. After interleaving, the extrinsic information delivered by the channel decoder { l 2 ( b k [ i ])} i;k is then used to compute the a priori symbol distributions { r k [ i ]} i;k defined in (8.23) from the corresponding LLRs as follows: i , based on the constraint structure of the code. The MAP channel decoder also computes the a posteriori LLR of every information bit, which is used to make a decision on the decoded bit at the last iteration. After interleaving, the extrinsic information delivered by the channel decoder { l 2 ( b k [ i ])} i;k is then used to compute the a priori symbol distributions { r k [ i ]} i;k defined in (8.23) from the corresponding LLRs as follows: Equation 8.67 
where the derivation of (8.67) is given in Section 6.3.2 [cf. (6.39)]. The symbol probabilities { r k [ i ]} i;k are then fed back to the Bayesian multiuser detector as the prior information for the next iteration. Decoder-Assisted Convergence Assessment Detecting convergence in the Gibbs sampler is usually done in some ad hoc way. Some methods can be found in [472]. One of them is to monitor a sequence of weights that measure the discrepancy between the sampled and desired distributions. In the application considered here, since the adaptive multiuser detector is followed by a bank of channel decoders, we can assess convergence by monitoring the number of bit corrections made by the channel decoders. If this number exceeds some predetermined threshold, we decide that convergence is not achieved. In that case the Gibbs multiuser detector will be applied again to the same data block. The rationale is that if the Gibbs sampler has reached convergence, the symbol (and bit) error rate after multiuser detection should be relatively small. On the other hand, if convergence is not reached, the code bits generated by the multiuser detector are virtually random and do not satisfy the constraints imposed by the code trellis . Hence the channel decoders will make a large number of corrections. Note that there is no additional computational complexity for such a convergence detection: We need only compare the signs of the code bit log-likelihood ratios at the input and output of the soft channel decoder to determine the number of corrections made. Code-Constrained Gibbs Multiuser Detector Another approach to exploiting the coded signal structure in Bayesian multiuser detection is to make use of the code constraints in the Gibbs sampler. For instance, suppose that the user information bits are encoded by some block code of length L and the code bits are not interleaved. Then one signal frame of M symbols contains J = M/L code words, with the j th code word given by  Let B k be the set of all valid code words for user k . Now in the Gibbs sampler, instead of drawing the individual symbols b k [ i ] one at a time according to (8.40) or (8.61), we draw a code word  [ j ] of L symbols from B k each time. Specifically, let [ j ] of L symbols from B k each time. Specifically, let  denote the code word with all entries being "-1". (This is the all-zero code word and is always a valid code word for any block code [565].) If the ambient channel noise is Gaussian, then for any code word denote the code word with all entries being "-1". (This is the all-zero code word and is always a valid code word for any block code [565].) If the ambient channel noise is Gaussian, then for any code word   B k , the conditional probability of B k , the conditional probability of  [ j ] = [ j ] =  given the values of the rest of the unknowns, can be obtained from given the values of the rest of the unknowns, can be obtained from Equation 8.68 
where  ; ;  ; and ; and  . On the other hand, if the ambient channel noise is non-Gaussian, we have . On the other hand, if the ambient channel noise is non-Gaussian, we have Equation 8.69 
The conditional distributions for sampling the other unknowns remain the same as before. The advantage of sampling a code word instead of sampling an individual symbol is that it can significantly improve the accuracy of samples drawn by the Gibbs sampler, since only valid code words are drawn. This will be demonstrated by simulation examples below. Relationship between the Gibbs Sampler and the EM Algorithm As noted previously, the expectation-maximization (EM) algorithm has also been applied to joint parameter estimation and multiuser detection [375]. The major advantage of the Gibbs sampling technique over the EM algorithm is that the Gibbs sampler is a global optimization technique. The EM algorithm is a local optimization method and it can become trapped by local extrema on the likelihood surface. The EM algorithm performs well if the initial estimates of the channel and symbols are close to their true values. On the other hand, the Gibbs sampler is guaranteed to converge to the global optimum with any random initialization. Of course, the convergence rate depends crucially on the shape of the joint posterior density surface. When the posterior distribution has several modes separated by very low density regions (energy gap), the Gibbs sampler, which generates "random walks" according to the distribution, may have difficulties crossing such gaps to visit all the modes. If such a gap is severe, the random walk may get stuck within one mode for a long time before it moves to another mode. Many modifications of the Gibbs sampler have been developed to combat the "large energy gap" situation (see, e.g., [162, 575]). Simulation Examples We now illustrate the performance in coded systems of the turbo multiuser detectors above. The channel code for each user is a rate- ½ constraint length-5 convolutional code (with generators 23 and 35 in octal notation). The interleaver of each user is independently and randomly generated and is fixed for all simulations. The block size of the information bits is 128 (i.e., the code bit block size is M =256). The code bits are BPSK modulated (i.e., b k [ i ]  {+1, -1}). All users have the same signal-to-noise ratio (SNR). The symbol posterior probabilities are computed according to (8.41) with n = N = 50. {+1, -1}). All users have the same signal-to-noise ratio (SNR). The symbol posterior probabilities are computed according to (8.41) with n = N = 50. For the first iteration, the prior symbol probabilities  for all symbols; in subsequent iterations, the prior symbol probabilities are provided by the channel decoder, as given by (6.39). The decoder-assisted convergence assessment is employed. Specifically, if the number of bit corrections made by the decoder exceeds one-third of the total number of bits (i.e., M /3), it is decided that convergence is not reached and the Gibbs sampler is applied to the same data block again. for all symbols; in subsequent iterations, the prior symbol probabilities are provided by the channel decoder, as given by (6.39). The decoder-assisted convergence assessment is employed. Specifically, if the number of bit corrections made by the decoder exceeds one-third of the total number of bits (i.e., M /3), it is decided that convergence is not reached and the Gibbs sampler is applied to the same data block again. Figure 8.5 illustrates the BER performance of the Gibbs turbo multiuser detector for users 1 and 3. The code bit-error rate at the output of the Bayesian multiuser detector is plotted for the first three iterations. The curve corresponding to the first iteration is the uncoded bit-error rate at the output of the Bayesian multiuser detector. The uncoded and coded bit-error-rate curves in a single-user additive white Gaussian noise (AWGN) channel are also shown in the figure (as, respectively, the dash-dotted and the dashed lines). It is seen that by incorporating the extrinsic information provided by the channel decoder as the prior symbol probabilities, the turbo multiuser detector approaches single-user performance in an AWGN channel within a few iterations. The BER performance of the turbo multiuser detector in impulsive noise is illustrated in Fig. 8.6, where the code bit-error rates at the output of the Bayesian multiuser detector for the first three iterations are shown. The uncoded and coded bit-error-rate curves in a single-user additive white impulsive noise (AWIN) channel are also shown in the figure (as the dash- dotted and dashed lines, respectively), where the conventional matched-filter receiver is employed for demodulation. Note that at high SNR, the performance of user 3 after the first iteration is actually better than the single-user performance. This is because the matched-filter receiver is not the optimal single-user receiver in non-Gaussian noise. Indeed, when K = 1, the maximum likelihood detector for the signal model (8.17) is given by  Figure 8.5. BER performance of a Gibbs turbo multiuser detector: convolutional code, Gaussian noise. (a) User 1; (b) user 3. Both users have the same amplitudes. 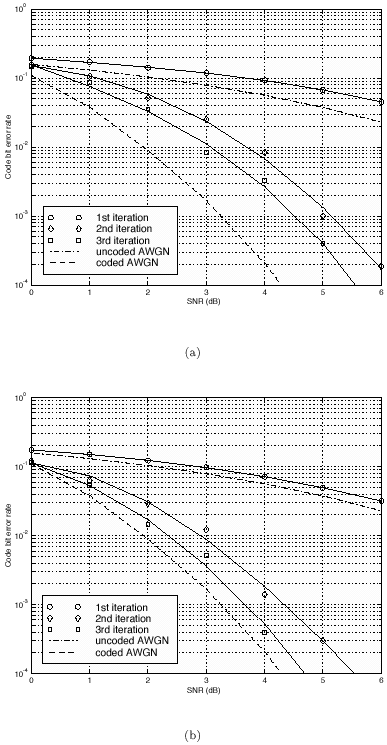 Figure 8.6. BER performance of a Gibbs turbo multiuser detector: convolutional code, impulsive noise. (a) User 1; (b) user 3. Both users have the same amplitudes.  and and  = 0.1. = 0.1. 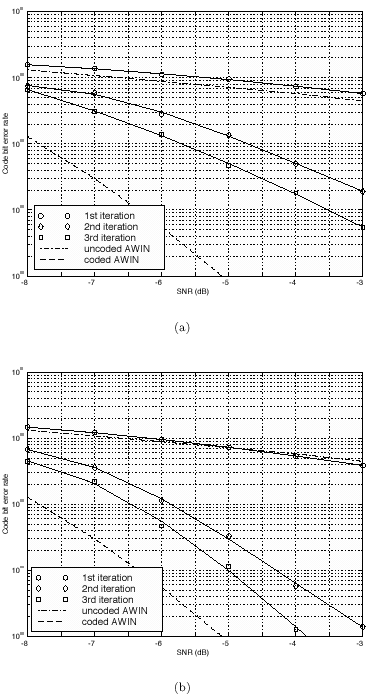 Finally, we consider the performance of the code-constrained Gibbs multiuser detectors. We assume that each user employs the (7,4) cyclic block code with eight possible code words [565]: 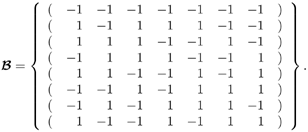 The BER performance of the code-constrained Gibbs multiuser detector in Gaussian noise is shown in Fig. 8.7. In this case the Gibbs sampler draws a code word from B at each time, according to (8.68). In the figure, the unconstrained Gibbs multiuser detector performance before and after decoding is also plotted. It is seen that by exploiting the code constraints in the Gibbs sampler, significant performance gain is achieved. The performance of the code-constrained Gibbs multiuser detector in non-Gaussian noise is shown in Fig. 8.8, and similar performance gain over the unconstrained Gibbs multiuser detector is evident. Figure 8.7. BER performance of a Gibbs turbo multiuser detector: block code, Gaussian noise. (a) User 1; (b) user 3. Both users have the same amplitudes. 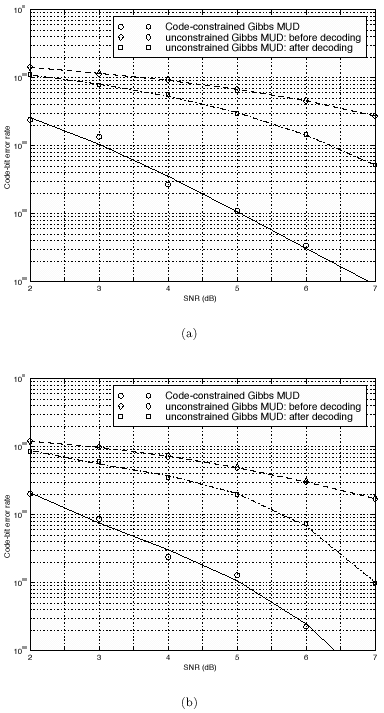 Figure 8.8. BER performance of a Gibbs turbo multiuser: block code, impulsive noise. (a) User 1; (b) user 3. Both users have the same amplitudes.  and and  = 0.1. = 0.1. 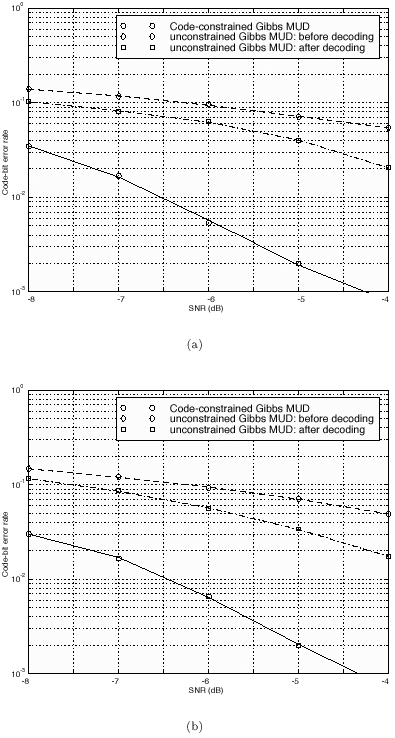 |

 < 1 and


 . However, since they involve only a finite number of samples, we think of them as approximations but realize that in theory any order of precision can be achieved given a sufficiently large sample size


 .
. 


