Implementing the Matrix Report This next section steps a bit deeper into report design and data modeling as I create a fairly sophisticated (in comparison to the reports I've already discussed) report using data from the Biblio database. This report is designed to visually analyze the total financial value of orders (OrderValue) and the number of orders (OrderCount). For this example, I'll use the Matrix report item to break down the data by U.S. state (State) to which those orders were delivered over time (Year, Month, Week, Day). The Data Considerations for a Report As with any serious reporting project, it's vitally important to understand how to best configure the rowsets that serve as the fodder for the reporting engine. Ideally, to extract this data from the Biblio database, you would issue an aggregate query. This means in T-SQL, you would use a GROUP BY clause. As you'll discover, the Matrix report item and the other ReportViewer report items used in this example can themselves perform grouping and sorting. However, in most cases, it's best to perform any grouping at the data source. Yes, it's best to let the DBMS engine do what it's designed to dogroup, sort, and return the pre-configured rowset products, especially considering that the database has indexes that can assist in the optimization of grouping queries (or, it had better have). To keep things simple, let's build up the query without any grouping. For this example, I need to target and process four tables in the Biblio database. These include the Items, Orders, Addresses, and ValidStates tables, as shown in Figure 14.56. Figure 14.56. The Biblio database tables used in the Matrix example. 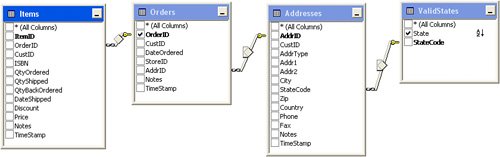
Let's take a closer look at some of the fields that must be built from expressions in the server-side query. Sure, composite column expressions can be done on the client by the ReportViewer, but it often makes sense (as it does in this case) to let SQL Server do the work. OrderValue: This field can be processed from the Items table and will be simply a calculation of the QtyOrdered field multiplied by the Price field: Items.Price * Items.QtyOrdered OrderCount: For the moment, let's ignore OrderCount and just return the OrderID. As you'll see later, counting orders is best done with the T-SQL aggregate function COUNT(). State: To extract a human-readable State Name, we need to JOIN the Orders table to the Addresses table to the ValidStates table. If you are really astute, you'll see that I have LEFT OUTER JOINS starting from the Orders table. Actually, in this, case, it may have been better for us to do equivalent joins, but that would depend on us having full confidence in the referential integrity (RI) of the database and the cleanliness of the data. For example, if there are any orders shipped overseas, their addresses would not have a valid StateCode value. If I used an equivalent join, I would drop rows that I would ordinarily include in the report. In financial reporting, dropping odd rows can have dire consequences. For example, if your report understates the company's total sales, the CFO might decide to axe your subsidiary because it's not profitable. Year, MonthName, MonthNumber, WeekNumber, DayName, DayNumber: In the report that we are eventually going to build, having the DateOrdered field broken down to Day will be very useful. The T-SQL expressions shown in Figure 14.57 are used to generate highly granular data values from the DateOrdered field. Figure 14.57. Using T-SQL to expose the DateOrdered field. 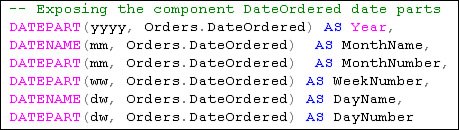
The Initial Select Query I'm ready to make a first cut at the SELECT query used to drive the report. This code is shown in Figure 14.58. Yes, this T-SQL will eventually end up in a TableAdapter query or (better yet) in a stored procedure that's executed to return a DataTable to be bound to the new report. Figure 14.58. The initial version of the report query. 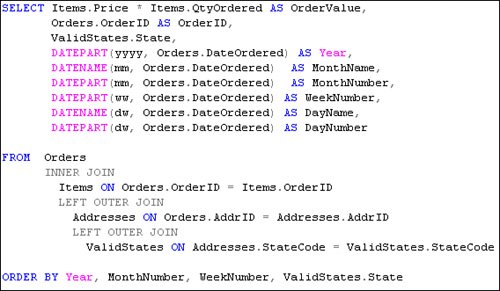
If you execute this query against the Biblio database, you'll find that you get back about 876,787 rows. That's really an awful lot of rows. Retrieving this behemoth rowset takes several minutes to execute query and to push those near million rows across the networkassuming the query is being executed on a remote server (as is usually the case when using the ReportViewer control). In this case, it makes abundant sense to perform as much aggregation on the database server as possible before pushing the rowset out over the networkespecially when you consider that, for this report, I don't need line-item detail. Grouping the Data By grouping the data on the server (as shown in Figure 14.59), I reduced the rowset to a mere 76,845 rows. That's still pretty big, but about  as large as the ungrouped rowset. Sure, many reports require you to build gargantuan rowsets that your client application must accommodate in memorynot to mention the load placed on your network to transport the rowsets to the client. as large as the ungrouped rowset. Sure, many reports require you to build gargantuan rowsets that your client application must accommodate in memorynot to mention the load placed on your network to transport the rowsets to the client. Figure 14.59. Using SQL Server to group the data for the Matrix report. 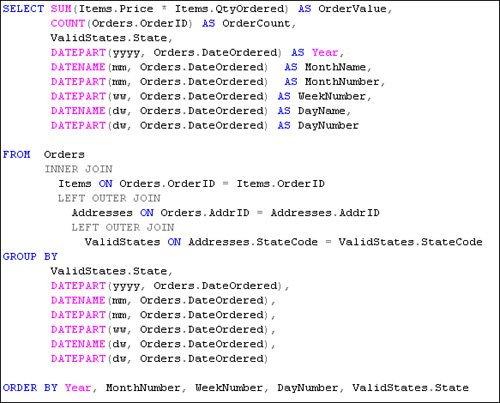
Grouping on the server does yield performance improvements, but not enough for us to be happy in an on-demand report in a real production system. The ungrouped query took about 2 minutes to execute on one of my machines, and that machine had little else that it was trying to do. Goodness knows how it would have performed if more than one person ran the query at the same timewhich would happen if more than one person asked for the same report at the same time. In contrast, the grouped query took about 22 seconds to execute. That's quite an improvement but still a strain on the system resources, as I saw the CPU heat up and go to 100% utilization for most of the time. It seems to me that this is still a long time for report users to waitand I still haven't rendered the report. If this report was executed simultaneously by more than one user, the time would have started to increase and would have brought the server to its knees. This brings us to one of my golden aims for reporting: "For the general case, an on-demand report (one that the user executes and actively waits for to render, rather than a report that's executed and received later) that cannot be displayed to the user within 10 seconds of the user asking for it is probably a badly designed report." As I discuss elsewhere in this book, I know that users get impatient. In some cultures, folks can get pretty irritated after a 10-second wait. Sure, in parts of Arkansas, it might take several hours for them to get a bit miffed, but in New York, watch out! Don't be fooled by performance that you see on a development system where you are the only user running a report. That's not a good benchmark for in-production performance. Build a Custom Report Cache Table In this situation, my data is relatively static, so I can help the situation by creating an output table that mirrors the dataset that the report requires and repopulating it on a regular schedule, perhaps an overnight job. In this case, I'm essentially caching the data so I don't have to endure the seemingly endless wait for the data to be retrieved. The table definition for the report table is shown in Figure 14.60. Figure 14.60. The BiblioOrderStatusTimeAnalysis table definition. 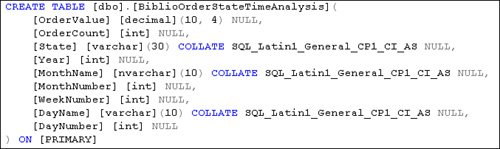
I can now populate this table by executing the T-SQL shown in Figure 14.61. Figure 14.61. Populating the report data cache table. 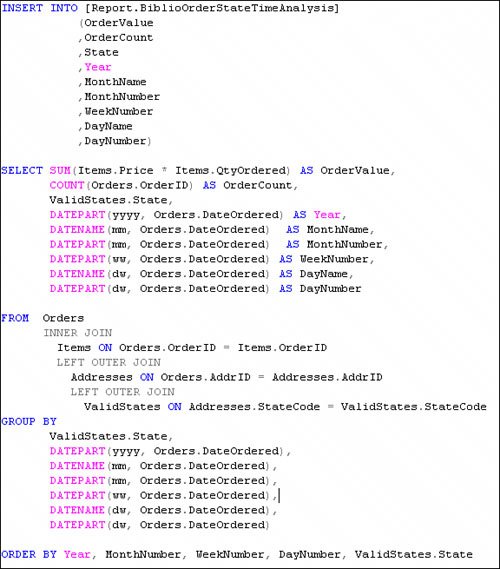
This approach enables us to issue very simple SELECT statements against the populated table from within the reportwithout fear of consuming vast amounts of CPU overhead on the server. The example in Figure 14.62 illustrates how this T-SQL is coded: Figure 14.62. Returning data from the report cache table. 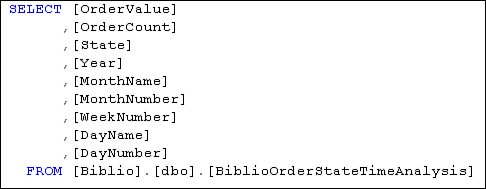
The data returned from this is still the 76,845 rows, but as all the heavy lifting and processing has been done beforehand, this resultset returns within 3 secondsthe CPU hardly registers any significant blip, since all it has to do is stream the data. However, in the pursuit of optimization, I created an issue of managing the updating of refreshing the data and updating this table. Now that I have dabbled with how to optimize the data for a report, let's get back to the fun part of designing a report. Before long, you'll be back to data when you start to create parameterized stored procedures for the report to execute. Building the Matrix Report As I have done so many times in this chapter, I'm going to create a new project and report to host the Matrix report item. I provide only the basic instructions hereyou already know how to do most of these steps. 1. | Create a new Visual Studio Windows Forms project called BiblioAnalysis to host the report. Create a new report called BiblioAnalysisReport.rdlc.
At this point, I have to define how I am going to get the data. This requires adding a new data source to the project.
| | | 2. | Select Add New Data Source from the Data menu, and use the Data Source Configuration Wizard to build a TableAdapter against the Biblio BiblioOrderStateTimeAnalysis table I just created. Select all of the columns in the table for your TableAdapter. You'll also want to make sure the data is sorted by year, month, week, and day of the week (by number). Your query should look like Figure 14.63.
Figure 14.63. SELECT query to return rows from the BiblioOrderStateTimeAnalysis table. 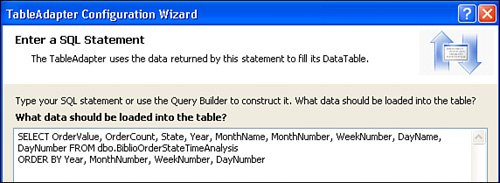
|
Tip Don't forget to include an Application Name if you want to trace queries with the SQL Server Profile tool.
Designing the Report Layout Using the Matrix Report Item I'm going to start the sample report using a Matrix report item. 1. | Open the report in the Report Designer and drag the Matrix report item to the report surface. Stretch it out a bit to make some space, as shown in Figure 14.64.
Figure 14.64. Configuring the Matrix report item. 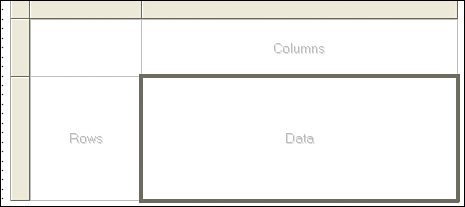
| 2. | Next, select a Rectangle report item from the toolbox and drag and drop it into the area of the Matrix that says "Data" in a ghosted font.
| | | 3. | Return to the Data Sources window and drag the OrderValue and the OrderCount fields directly into the data Rectangle. You'll see that the Designer automagically creates TextBoxes for you and also creates aggregates of Sum on the field values. The designer did this because you are in the Data area of a Matrix, and the way in which a Matrix works only makes sense for aggregate values to be placed here.
| 4. | Return to the Toolbox and drag two more TextBox report items to the Matrix report item "Data" area to use as labels for the OrderValue and OrderCount TextBox report items. You'll need to fill in the text, as shown in Figure 14.65.
Figure 14.65. Positioning the OrderValue and OrderCount fields on the Matrix report. 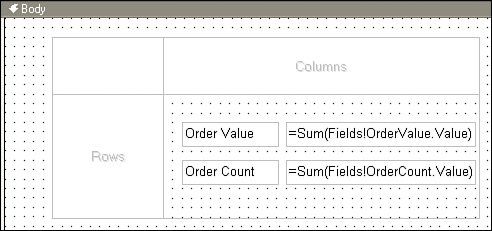
| 5. | Drag the DayName field and drop it into the "Columns" area of the Matrix report item.
| 6. | Drag the WeekNumber field and drop it into the "Rows" area of the Matrix report item.
| 7. | Select the TextBox report items that contain data fields and set the Format property for the OrderValue and OrderCount. Use format expressions of "$#,###.00" and "#,###" for these two controls. This instructs the RDLC to format the money values so they are easier to read.
| 8. | Set the DayName TextBox report item to bold with a gray BackgroundColor.
| | | 9. | You'll find it helpful to select the Matrix and set the border property of each column and row to "solid". Drag the handles on the Matrix to tidy it up so that it is neatly presented, as shown in Figure 14.66.
Figure 14.66. The suggested layout of the Matrix report item. 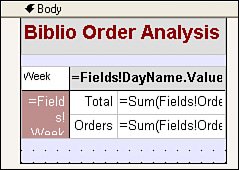
It's important to make these cells as small as possible, as a Matrix report can get very large when the generated columns are added at runtime. To this end, I subsequently reduced the size of the "label" TextBox report items and shortened the text. I also manually set the "height" of these items to reduce the inter-cell spacing.
I also added a title TextBox and changed the BackgroundColor properties of the elements to make the report easier to read. This illustrates how the colors bleed through to the lower layers if you leave them set to "Transparent" BackgroundColor.
|
Testing the Matrix Report At this point, we're ready to test the report to see if we've missed anything. 1. | Close and save the BiblioAnalysisReport.rdlc file and return to the Windows Form. Add a ReportViewer control to your form and click the ReportViewer Tasks button. Make sure that the BiblioAnalysisReport.rdlc is selected. This adds code to the Form_Load event handler to populate the TableAdapter and render the report.
| 2. | Verify that the Data Source has been wired to your report by clicking on the "Choose Data Sources" hyperlink. This launches the "Choose Data Sources Dialog". If the Data Source instance is not filled in, you'll need to drill down into the Project Data Sources and select the BiblioDataSet. Click OK to close the dialog.
| | | 3. | By using this technique to set the Data Source, Visual Studio and the ReportViewer create three items in the project tray. These classes (as discussed earlier in the book) expose the DataSet, BindingSource, and TableAdapter to your Form. Unfortunately, I don't want the report to render when the Form loads, so I'll move the generated code to my own button Click event, as shown in Figure 14.67.
Figure 14.67. Move the generated code to the button Click event. 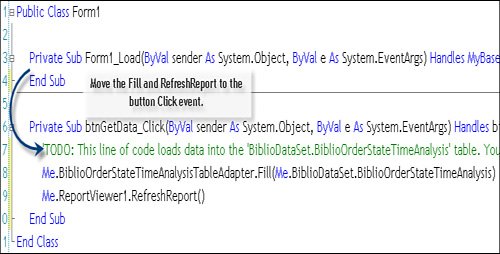
| 4. | Run the application and click the "Get Data" button to render the report. If you set the zoom out far enough, you'll see the entire reportat least, the first few weeks, as shown in Figure 14.68.
Figure 14.68. The Biblio Order Analysis Matrix report item report. 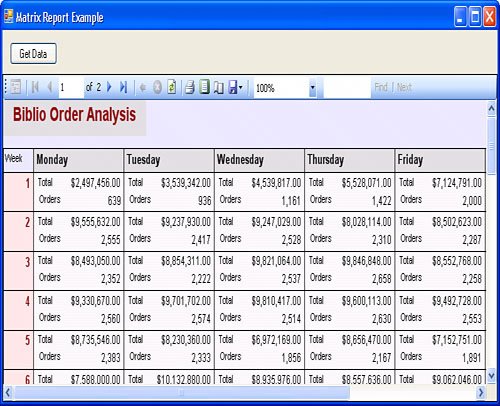
|
The report shown in Figure 14.68 is a first step. If you navigate down to the third page, you'll see that there are only 53 rowsone for each week. However, the values are aggregated for all years, so it would be helpful to split out each year. One approach would be to drag the Year field to the Matrix rows Landing Zone, as shown in Figure 14.69. I also added text to the heading to reflect this added level of grouping. Again, these fields are made as small as possible to keep the report compact. Figure 14.69. Adding another level of grouping to the Matrix. 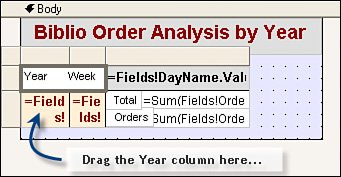
I also made another change. As discussed earlier in this chapter, I wanted to be able to give the user the ability to see both versions of the report (with and without year aggregation), so I included code to switch from one report to another. Since both reports use the same Data Source, I added logic to bypass the Fill method once it's been done once. The code used to manage this report-switch approach is shown in Figure 14.70. Figure 14.70. Switching between reports. 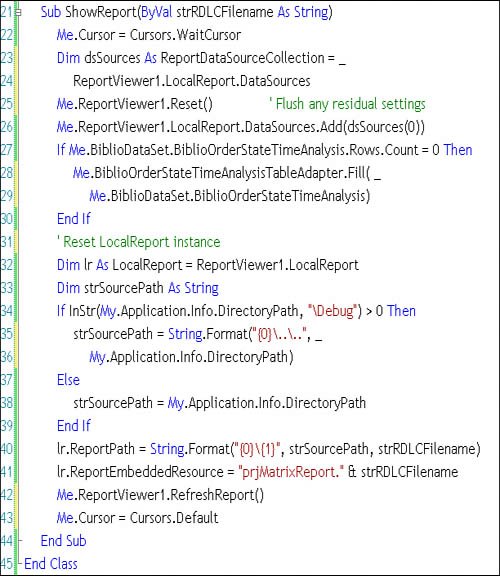
When this new version of the application is executed, each year is broken out into a separate group and the report grows to about 20 pages, as shown in Figure 14.71. Figure 14.71. The Biblio Order Analysis by Year Matrix report. 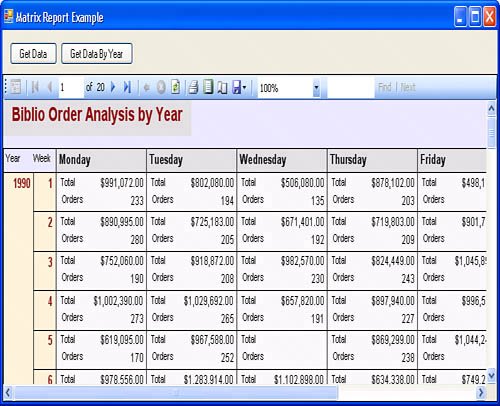
Another technique that can be implemented with the Matrix report item is the "Calendar" effect. In this case, I use two nested List report items and nest the Matrix within the inner List item. To implement, this follow these steps: 1. | Select the Matrix report item (not one of the items contained therein) and open its extended properties dialog by right-clicking on the report item.
| | | 2. | Next, select the Groups tab and remove the Matrix1_Year rows grouping by selecting it and clicking Delete. Your Groups configuration should now look like Figure 14.72. Close the properties dialog.
Figure 14.72. The edited Matrix properties groups. 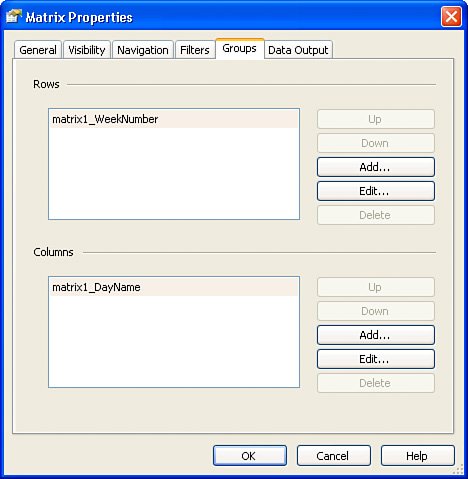
| 3. | Next, drag a List report item onto the Report layout; then, select the Year field from the BiblioDataSet and drag that into this List.
| 4. | Drag another List report item to be a child within the first List item. Place the MonthName field from the BiblioDataSet within this inner List item.
| | | 5. | Drag the Matrix report item to the inner List item. Figure 14.73 shows what the layout should now look like. No, we're not quite ready to test yet.
Figure 14.73. The Biblio Order Analysis Calendar Matrix report layout. 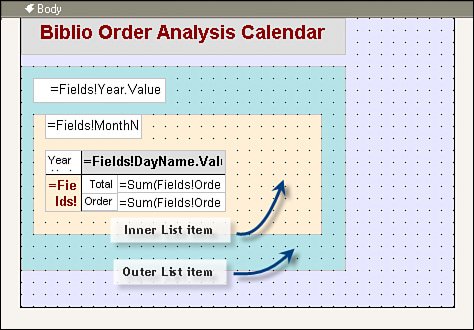
| | | 6. | Select the outer list and pull up its properties (right-click and select Properties). Click on "Edit Details Group". You should now see the "General" tab of the Grouping and Sorting Properties.
I need to group and sort the data on Year in descending order so that the report shows the most recent data values first. Using the drop-down list in the Expression dialog, choose "=Fields!Year.Value".
| 7. | Using this same Properties dialog, set the "Document map label" to "=Fields!Year.Value" (as shown in Figure 14.74) so the report displays a Document Map on demand. As you'll see, the document map facilitates navigation within the report. Click OK on the Grouping and Sorting Properties dialog.
Figure 14.74. Configuring the List item properties to group by year. 
| | | 8. | I now need to set how the data is sorted. This needs to be done not on the Sorting tab of the Grouping property page, but on the Sorting tab of the List properties itself (as shown in Figure 14.75). Select the Sorting tab and, using the drop-down list of Fields, choose the Year and "Descending" as the direction.
Figure 14.75. Setting the List item sort sequence. 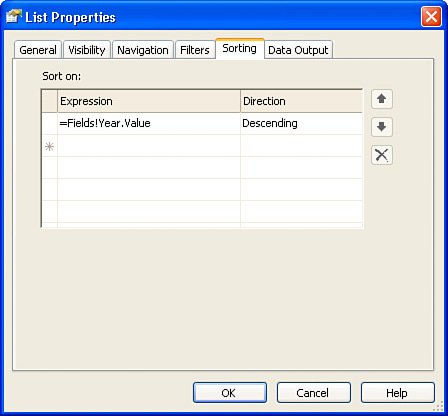
| | | 9. | Now, select the inner List and open its properties dialog (as shown in Figure 14.76). You may find that you need to set the Data Set name on General tab of the properties dialog. Again, simply use the drop-down list to select BiblioDataSet_BiblioOrderStateTimeAnalysisit's the only choice, as only one Data Source is defined for this project.
Figure 14.76. Setting the Data set name for the List item. 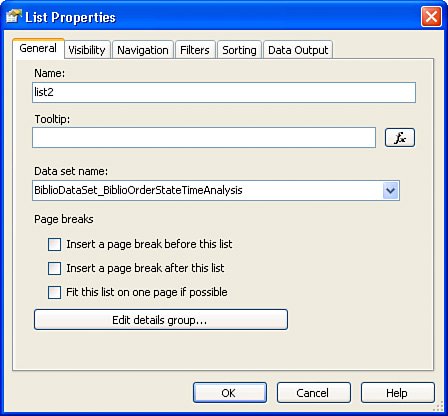
| | | 10. | Next, click the "Edit details group..." button. Set the Group on expression to the MonthName. Set the Document map label expression to the same field. Be sure to check the Page break at end, as shown in Figure 14.77. Click OK on the Grouping and Sorting Properties dialog.
Figure 14.77. Setting the inner List item properties. 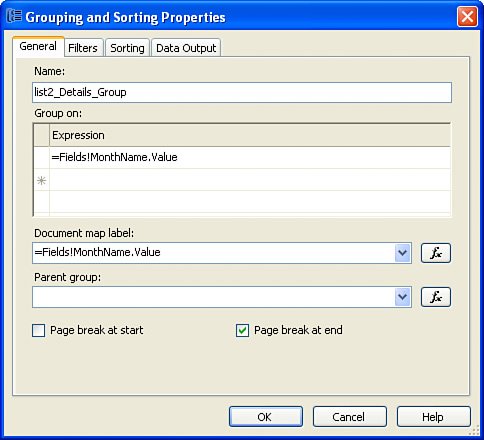
| 11. | Click on the Sorting tab of the outer List item. In this dialog, set the Sort Expression to sort on the MonthNumber, as shown in Figure 14.78.
Figure 14.78. Setting the sort order on the inner List item. 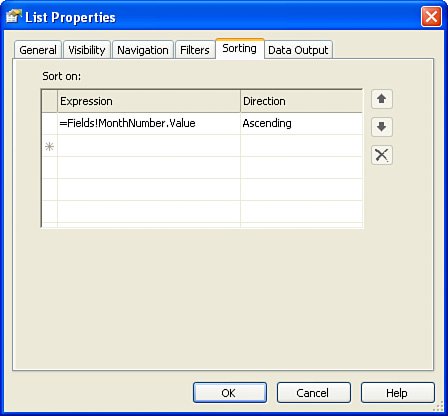
| | | 12. | We're almost donejust a couple more steps to make the report look more like a normal calendar. If you run the report at this point, you'll get over 130 pages. If you look closely at the report, you'll notice that although the days of the week happen to be sequential, they don't have a consistent starting point from month to month. This can be corrected by opening the Matrix report item properties dialog as shown in Figure 14.72.
| 13. | Select the column grouping of Matrix1_DayName and click the "Edit..." button.
| 14. | In the Grouping and Sorting Properties for Matrix1_DayName, click the Sorting tab and select the "Sort on:" expression to the DayNumber Field value, shown in Figure 14.79.
Figure 14.79. Set the DayName sort sequence 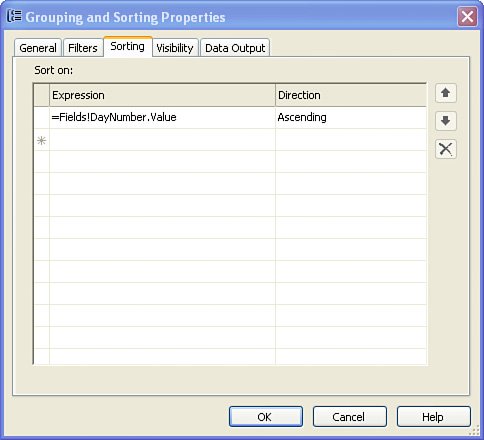
| | | 15. | I encourage you to experiment with your report and make whatever changes you find useful. I made a few more tweaks and ended up with the report in Figure 14.80.
Figure 14.80. The final Biblio Order Analysis Calendar report. 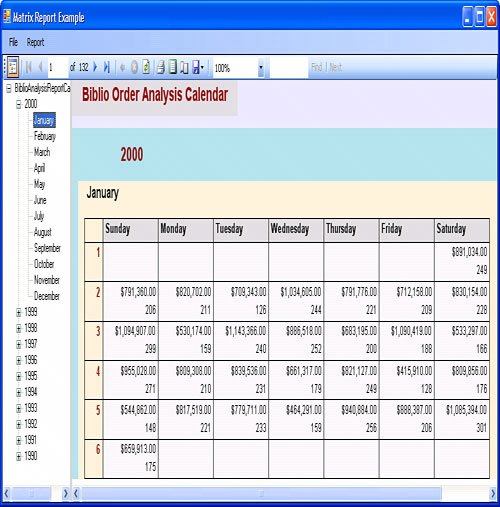
You can see the Document map on the left showing the Year numbers from the outer list in descending order, and then the month names from the inner list sorted in Month Number order. I added some code to tune the width of the Document Map area, but you can hard-code this by setting the DocumentMapWidth and DocumentMapCollapsed properties in the properties dialog.
|
|