Advanced Reporting Techniques
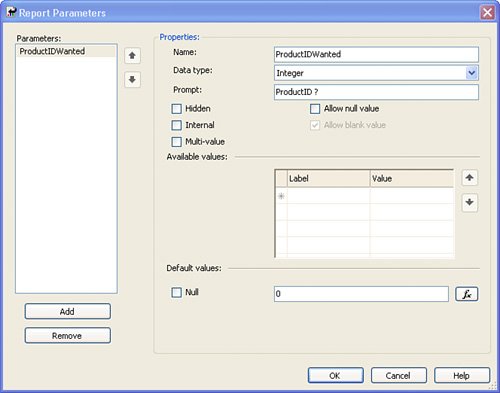
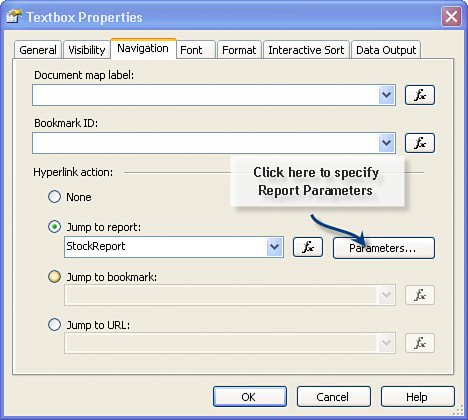
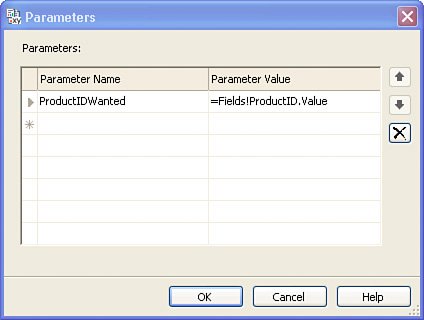
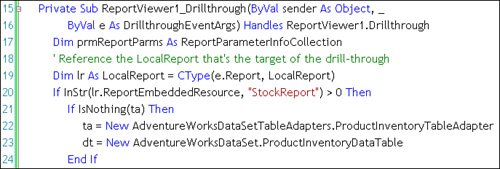
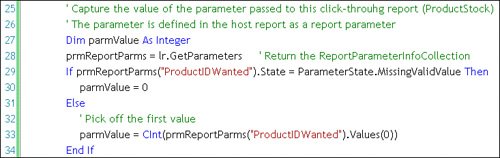
| This section discusses a few of the more complex aspects of report creation and management, including how to set up click-through reports and how to include subreports in your reports. These topics are included, as they're programmed entirely differently than the techniques discussed in our Reporting Services book. Managing Click-Through ReportsOne approach that you're going to want to try is creating a "click-through" report. Imagine, if you will, a report that displays limited information about a productbut enough for most uses. However, to fetch additional information, the user is prompted to click on a specified field (as shown in Figure 14.42). This launches a "click-through" report (as shown in Figure 14.43). The magic here is that the ReportViewer is automatically reprogrammed to point to the targeted drill-through report and pass zero to many parameters to the report. That is, a new ReportViewer or Windows Form is not createdthe existing form and control are reused. This means that your user will have to use the "back" button to return to the host report. Thankfully, this transition is handled automaticallyas long as you use the "back" button. Sure, if you want to pass parameters to the drill-through report, you're going to need to write some code to fetch the parameters and run a custom query. I'll show how that's done later in this section. Figure 14.42. A report hosting a drill-through report.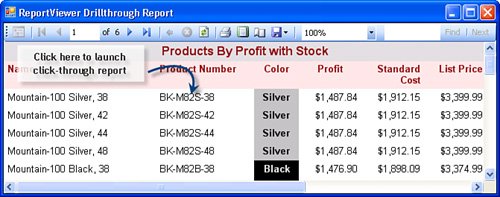 Figure 14.43. The drill-through report.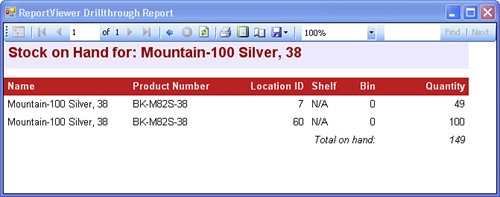 Note that this "drill-through" approach is different from a SubReport (that I discuss later in this chapter). In contrast, a SubReport is embedded in a Table report item cell or co-located on the report surface. In either case, you'll need to provide a fresh DataTable and Data Source to connect the report items with the data that populates them. When accessing a report programmed for drill-through operations, once you click the pre-programmed Table report item cell, the ReportViewer launches the specified (possibly parameter-driven) report to show more detailed information about the selected cell, as shown in Figure 14.43. Behind the scenes, you might have to trap the ReportViewer Drillthrough event, where you execute the (parameter) query used to populate the drill-through report. I'll show you how next. Okay, this seems cool, but getting to this point is a challenge, given the sorry state of the documentation. Let's walk through the process of getting to this statestep by step.
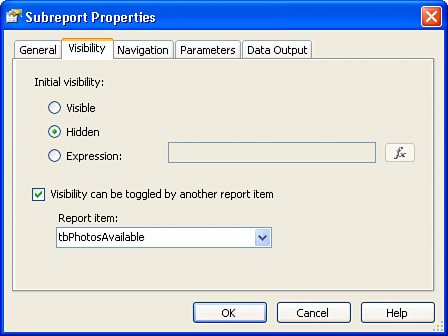
Remember that when you use this approach, the user has to press the "back" button to return to the host reportunless you provide your own navigation buttons. Any Table item cell or TextBox item can be programmed as a "button" or hot-spot by setting the navigation properties. Sure, if you want to support additional cells that drill through to other drill-through reports, you'll have to create logic in the Drillthrough event handler that checks to see which drill-through report is being requested. In the final version of the prjClickThroughReport application, I implemented this functionality to illustrate this, as shown in Figure 14.50. Once this is configured, the targeted drill-through report can act as a host and launch additional drill-through report(s). Remember, the ReportViewer control is maintaining a "stack" of reports so that your user can navigate back to the original report. Figure 14.49. Executing the custom Fill method and setting the Data Source.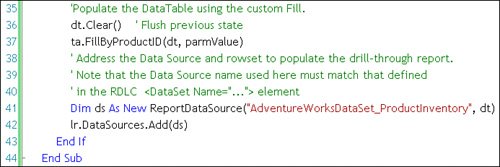 Figure 14.50. Branching based on the drill-through report name requested.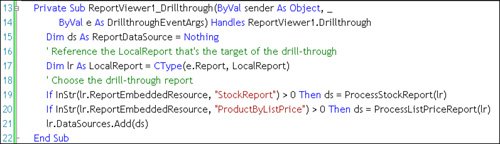 Using the SubReport Report ItemAnother approach you can implement to show additional detail leverages the SubReport item. This technique is a bit easier to implement when compared to the drill-through reports I just discussed, but it includes a number of other nuances that I need to discuss. The example application is similar to those I've already shown you, but in this case, I create a subreport that displays the available photographs of selected products. The subreport can be positioned in a number of places, including on the report surface or in a Table item cell. I chose the latter for this example, as it best fits with the report's interactive "finder-detail" design. That is, the host report simply lists products (that have photos) but does not show the pictures for each row. Even though the pictures are not initially shown for each item (as shown in Figure 14.51), the ReportViewer invoked the SubReport for each row returned in the Products query. This is pretty expensiveone round-trip query for every row in the Products table. Figure 14.51. The host report with the SubReport item hidden.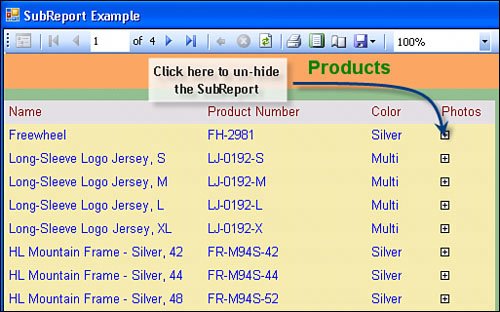 In this case, I set the Visible property of the SubReport using a TextBox cell in the Table item. When the user clicks on the "+" sign, the ReportViewer toggles the SubReport Visible property. This is programmed via the SubReport item properties page, as shown in Figure 14.52. Sure, you can write an expression to hide the SubReport (or most items). Figure 14.52. Programming the visibility of the SubReport item. Once the user clicks the "toggle" item in the Table item cell, the SubReport item is made visible (as shown in Figure 14.53). Figure 14.53. Toggling the Visible property of the SubReport.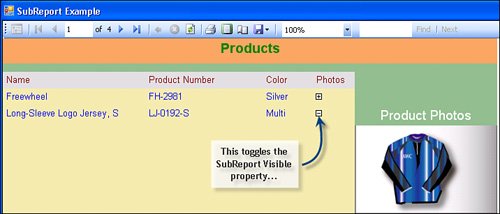 No, this is probably not the best way to implement a subreport. A more efficient approach would be to construct the report so that the SubReport was not rendered along with each row fetched. In this case, the SubReport would be placed outside of the Table cells. The problem with this approach is that, unlike the drill-through report, you can't launch it from a cell in the Table report item. For the example (shown in Figure 14.54), I created a report that generates a small chart that reflects the overall sales of this product line. In this case, the code to generate its rowset is called only oncewhen the report is first rendered. Figure 14.54. Rendering a SubReport item outside of the Table.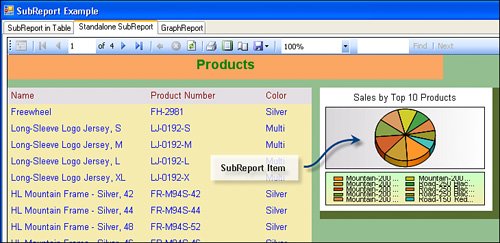 As you can see, I used the Chart report item in the last SubReport example. I devote an entire chapter to the Chart report item in our Reporting Services book. There, you will find details on how to configure the Chart report item to generate a wide variety of charts and graphs. Note that Reporting Services 2005 now supports "control extensibility"that is, third-party vendors can (and have) adapted their custom report items to Reporting Services 2005. For example, the Dundas Chart report item has been so adapted. Unfortunately, these third-party report items do not work with the ReportViewer control. That said, it really isn't that much of a limitation. Because you have control over data extraction, you can use custom-built controls to return binary image streams and consume them within the image control. Conceptually, this is not much different from how the custom report items work. What's in the RDLC?I've often had to dig into the report definition file to debug one problem or another or resurrect a dead or crippled report. The Report Definition Language (RDL) variation generated by Visual Studio for use with the ReportViewer control is not that different. It has a different extension (RDLC) but shares a great deal of functionality with the BI-tools generated RDL files. The "C" stands for "client" as these reports are designed for execution on the clientnot the server by Reporting Services. Remember that while the RDL and RDLC report file contain information about the SELECT, the Data Source, and even the ConnectionString, the client-side ReportViewer control does not use all of these elements in the same way. The <DataSets> BlockThe core of the RDLC file is the DataSets block as shown in Figure 14.55 Note the presence of entire query (the CommandText attribute), references to TA Fill and GetData methods, SELECT, and DataSourceName and ConnectionString in the <DataSets> block. Many of these sections in the RDLC are required for it to compile (a process that's repeated each time against each RDLC file once you start the application). The <CommandText> element (this contains the SELECT statement) and the <rd:DataSetInfo> sections do not need to be filled in, as they are not run by the ReportViewer. These methods are up to your code to runnot the ReportViewer. Figure 14.55. The RDLC report definition dumped to XML.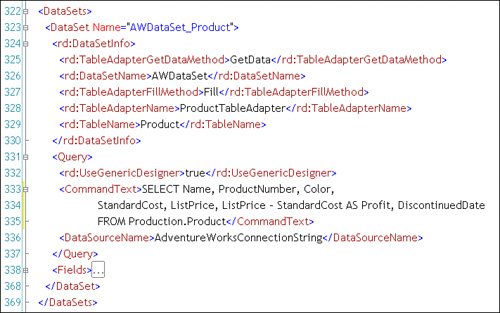 Note that the DataSet Name element must be present and must point to the DataTable (or equivalent)it's referenced in the LocalReport instance. Fields are mapped to report Fields but are otherwise not referenced. The values in this block are set when columns are dragged from the Data Source window to the report designer report items. These settings would be used if the report was to be rendered by Reporting Services, but since they're generated from a strongly typed TableAdapter, they can't be run on SQL Server Reporting Services as is. Converting RDL to RDLCOkay, so you got your boss to sign on to Reporting Services and you've invested a couple of months (or a year) creating reports using the BI tools or Visual Studio 2003's Reporting Services add-in. Now, you want to leverage that work with the ReportViewer control. Of course, the simplest thing to do is launch the server-side report using the ServerReport mode of the ReportViewer control. If you need to execute the report on the client for any reason, you'll need to convert the RDL to RDLC format. Unlike some other XML fiascos (as when you tried to use ADOc Recordsets persisted as XML in ADO.NET), the transition to RDLC is really pretty easy because the schema for both files is identical. While the ReportViewer control ignores the <Query> element, the other elements and attributes are processedalbeit in somewhat different ways. Basically, to convert an existing RDL report to RDLC, you're going to need the RDL XML file. This can be extracted from SQL Server by using the Reporting Services Report Manager or by bribing the developer that owns the file. Ah, only Reporting Services 2005 RDL files can be imported and converted to RDLC format. If you're working with Reporting Services 2000, you'll need to use the BI tools to open each RDL report and let the tools convert the RDL to the new format. Of course, this is a one-way conversionthere is no tool to convert them back to Reporting Services 2000 format. Once you have the RDL (2005-format) file, you need to follow these steps:
For more information and details about how to convert RDLC reports to RDL format, see http://msdn2.microsoft.com/en-us/library/ms252109.aspx. |
EAN: 2147483647
Pages: 227