Monitoring and Optimizing a Server Environment for Application Performance
In Windows Server 2003, Microsoft has included the Configure Your Server Wizard, which tunes your server for specific roles on your network. Even though Microsoft has done a fairly good job with defining the server roles and configuring the performance options for each role, you can always do better. In this section, we examine the tools and utilities you can use to optimize your server's performance. Exam Alert: Configure Your Server Wizard The Configure Your Server Wizard is not included in the Windows Server 2003 Web Edition operating system, which is logical because that version is intended to be used only for web servers, and it comes optimized for that role out of the box. As an administrator, you should be familiar with the capabilities of all versions of Windows Server 2003 for the exam. Monitoring System ResourcesAlthough Task Manager can give you a quick overview of system performance, there are situations in which a more thorough investigation is needed. This is where the Performance tool comes in handy. The Performance tool is actually made up of two separate Microsoft Management Console (MMC) snap-ins: System Monitor and Performance Logs and Alerts. The Performance tool is started by following the procedure outlined in Step by Step 14.4.
System MonitorThe System Monitor snap-in allows you to view real-time performance data contained in the counters from your domain controllers, member servers, or workstations on your network. In addition, System Monitor allows you to review performance data that is stored in a log file created with the Performance Logs and Alerts snap-in. Windows Server 2003 is a modular, object-oriented operating system. Each subsystem within Windows Server 2003 is an object. For example, the CPU is an object, the memory is an object, the storage subsystem is an object, and so on. As your computer performs various tasks, each of these objects generates performance data. Each object has several monitoring functions called counters. Each counter offers insight into a different aspect or function of the object. For example, the memory object has counters that measure % Committed Bytes in Use, Available Bytes, Page Faults/sec, and more. System Monitor takes the readings from these counters and presents the information to you in a human-readable format (numbers or graphs). Each counter is displayed as a colored line. Multiple counters from the same system or from remote systems can be viewed simultaneously. In addition, objects can be separated by instance. Instance is the terminology used to refer to multiple occurrences of the same type of object, such as in a multiprocessor server. A separate instance exists for each processor. By default, System Monitor is started with the following counters displayed:
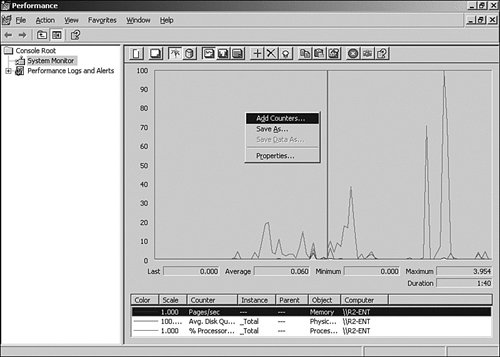
Numerous other counters can be added to give you a more thorough view of your server's performance. To add additional counters to be monitored, perform the procedure outlined in Step by Step 14.5.
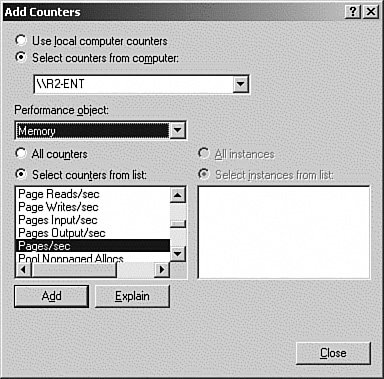
As you saw in this Step by Step procedure, the Add Counters dialog box allows you to make choices from several areas to customize your monitoring needs. The choices found on this dialog box are as follows:
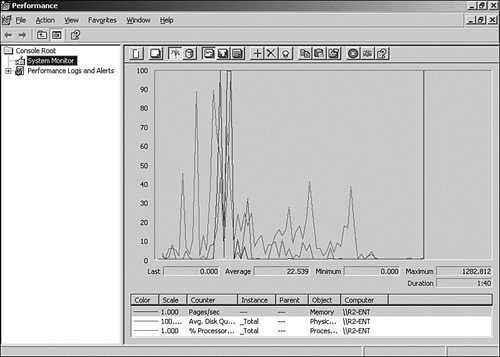
After selecting each counter, click the Add button to add the counter to the System Monitor display. For a description of each counter, highlight the counter and click the Explain button. When you're finished, click the Close button. The number of objects available for monitoring varies by system. Most server services and applications, such as DNS, DHCP, and mail servers, install their own counters that can be used to monitor the performance of those functions. Each counter can be displayed as a colored line in one of the graph views. Multiple counters from the same system or from remote systems can be viewed simultaneously. Figure 14.16 shows you an example of what one of the graph views, of which there are several, may look like on your system. Figure 14.16. The Windows Server 2003 System Monitor showing several additional server-usage counters.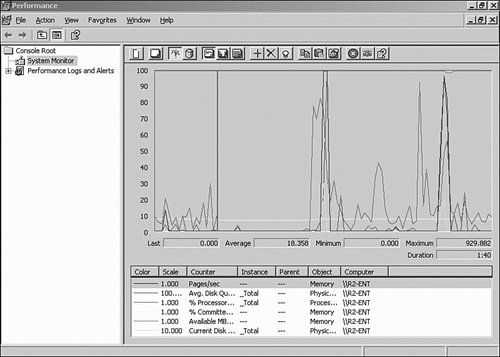 Of all the items you can monitor on a typical server, here are the objects you need to monitor closely for performance issues:
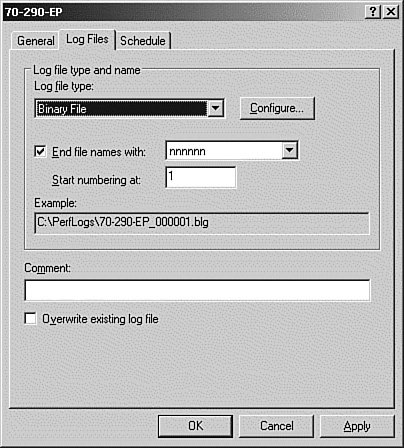
These counters provide instant insight into the overall performance on a system. When these counters get too high, it's a good indication that you need to upgrade the system or segment the network. The Performance Logs and Alerts Snap-InAlthough System Monitor provides far more system-monitoring information than Task Manager, it still provides only a snapshot view of system performance. To perform a more thorough evaluation of system performance, you need to view the system statistics over a period of time. You can find these statistics in the Performance Logs and Alerts tool, located under System Monitor in the Performance tool MMC. The following two subsections detail the logging and alert features you can use to capture performance data over an extended time period. Performance LogsThe Performance Logs and Alerts MMC snap-in allows you to log performance data over a period of time and save it to a log file for later viewing. Two logging options are available: Counter Logs and Trace Logs. Counter logs allow you to record data about hardware usage and the activity of system services from local or remote computers. You can configure logging to occur manually or automatically based on a defined schedule. Trace logs record data as certain activity, such as disk I/O or a page fault, occurs. When the event occurs, the provider sends the data to the log service. Exam Alert: Trace Logs Trace logs are commonly used for developers to trace an application's interaction with the operating system. It will probably not be covered on the exam. The snap-in allows you to save log data in the following file formats:
Because the data is available in so many common formats, you have the option of analyzing the data using the default Microsoft tools or importing it into the tool of your choice. Note: Establishing a Baseline You should take a measurement of your system during its normal operation to establish a baseline. This baseline provides something to compare counters to when the system experiences problems. A baseline comparison provides a quick way to pinpoint problem areas. The Performance utility allows you to log on an object basis and on a counter basis. This means you can configure a log to record all the data for an object instead of using individual counters. Therefore, after a log file is recorded, you can select any counter from an object to examine. After you determine what to record, you need to determine two time-related issues: the measurement interval and the length of time to record the log file. These issues are detailed as follows:
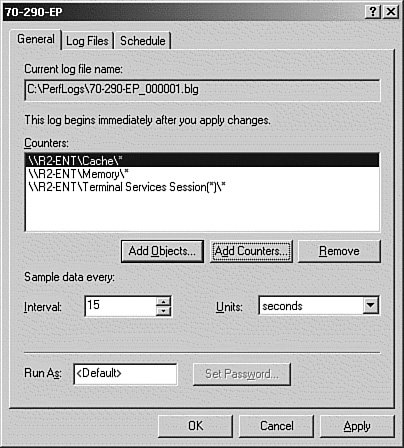
The sample log is defined with the following basic counters:
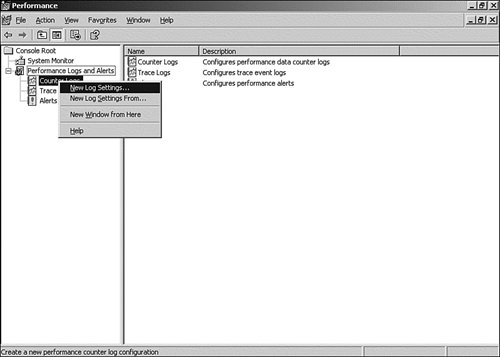
Note that these are the same counters that appear in the initial System Monitor view. You can create your own logs with the counters you specify. To create a new counter log, perform the procedure outlined in Step by Step 14.6.
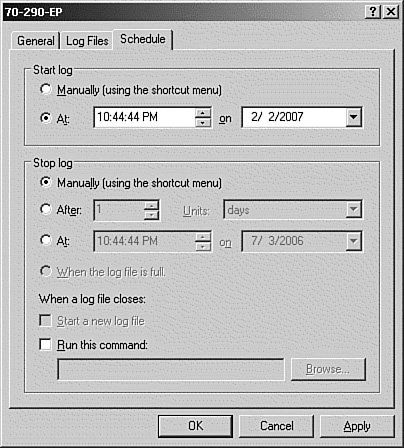
If you selected to manually start the counter log, you can start it by right-clicking the log entry in the right pane of the Performance Logs and Alerts snap-in and selecting Start. The icon for the log is green when running and red when stopped. After you have recorded data in your log file, you can view it within System Monitor. To open your log file, use the procedure outlined in Step by Step 14.7.
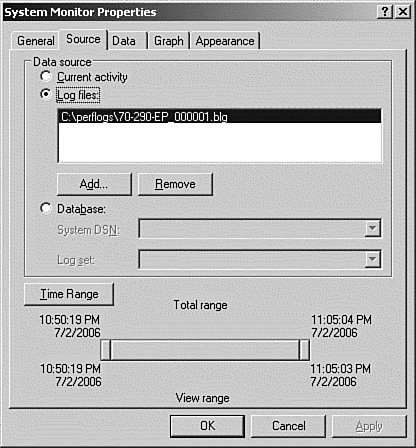
A time window is a selected block of time from a log file. When a log file is used as the source of data, the System Monitor utility automatically sets every data point within the log file as activethat is, it views the data from the start to the end of the log file. Through the use of a time window, you can shorten or otherwise alter the data in use. The Source tab from the Log Properties dialog box reveals the Time Range settings. From this dialog box, you can slide the start and end points manually to select your start or stop points. Only the data in the selected time frame (between the start and stop points and shaded gray) is used by the System Monitor utility. While a log is being recorded, don't try to view the log file from the same instance of the Performance utility that is performing the logging. If you need to view the contents of the open log file, use another instance of the Performance utility. You can view all data points up to the point when you opened the log file, and new data continues to be recorded into the file by the first instance of the Performance utility. After a log file is recorded, you can append and resample the file to combine multiple files or to remove spurious readings. To record new data into an existing log file, just specify the path to the existing file in the Log Options dialog box. The only limitation to log file recording is the free disk space on the destination drive; if your hard disk is full, the log file cannot record unless it is emptied or deleted.
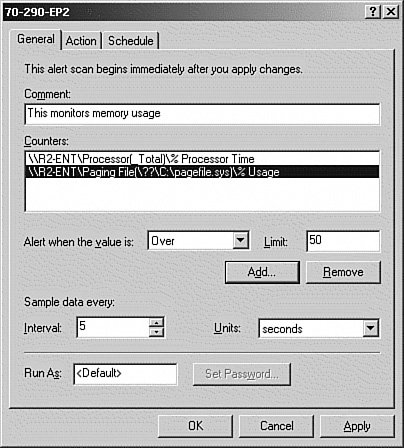
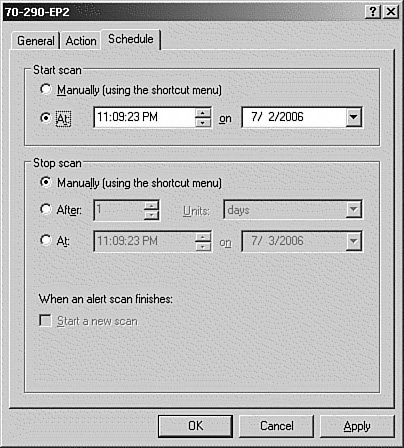
Trace LogsThe second type of logs is trace logs. Trace logs are used to track lower level events supplied by data providers that are part of the .NET Framework. Trace logs are set up exactly like counter logs, except they will have the extension .etl. A major difference between trace and counter logs is that while counter logs take samples, trace logs track events continuously. Trace logs are used by developers and require special software tools to read them. You can find out more about trace logs at http://msdn.microsoft.com. Performance AlertsThe Alerts container is used to define threshold alerts. These can be used with real-time measurements or with historical log files. An alert is issued when a specific counter crosses a defined threshold value. When this occurs, a trigger event is initiated. Creating an alert is similar to configuring a counter log. To create an alert, perform the procedure outlined in Step by Step 14.8.
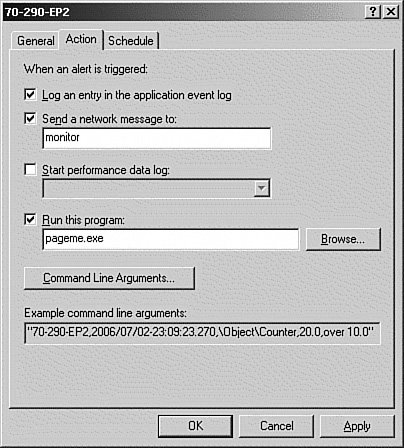
You can select several actions to be performed when an alert threshold is reached, as follows:
Alerts are most often used to monitor systems in real time. You can set an alert to notify you when a specific event occurs. Some of the conditions that you might want to configure an alert for are low disk space, swap file usage, and task queues for network cards and CPUs. Any of these items can point to a current or potential system problem. |
EAN: 2147483647
Pages: 219