14.6 Operating system tuning
|
| < Day Day Up > |
|
14.6.1 CPU utilization
CPU utilization is the amount of time that the active CPUs on the system are working on running processes. CPU utilization statistics presented by the sar -u command (on a Unix system) is displayed as a composite of the %System, %User, and %Idle times, where the addition of all three parameters will equate to 100%. A lower %Idle time indicates a higher workload.
System and user statistics represent the proportion of time the CPUs are working on system-related activities or user-based programs, respectively. In a normal workload, %System should not consume more than 20% of CPU utilization. CPU utilization information is made more meaningful when combined with the run queue length and run queue occupancy statistics. For example, if the server is running close to the 95% utilization level, does this indicate an immediate CPU deficiency on the server? The answer is, we don't know yet. If this is a single CPU system and the run queue is consistently at a value of 1 then the answer is, it's difficult to arrive at any definite conclusion. If the run queue length consistently exceeds the number of CPUs on the system and the run queue occupancy is consistently high together with a high CPU utilization rate, then this would indicate a CPU deficiency.
An ideal situation for the server would be to consistently run under the 90% utilization level with a stable workload. In this situation, the investment in CPU power is justified, since the utilization rate is high, yet it is not at its maximum. The reality of most servers is that workload fluctuates throughout an entire day and rarely shows as stable. The measurement of CPU utilization can help in identifying shortfalls in CPU processing power.
This is especially true during peak periods where the demand of CPU resources can exceed those available and cause system wide performance degradation. The sar -u command will generate the CPU utilization statistics.
The graphical output shown in Figure 14.2 is generated from the data gathered using the sar -u command over a 2-hour time frame. The output was fed into MS Excel4 to generate this graph. It shows that the system has had several spikes with 100% CPU utilization at several periods, and is worth drilling down into. It can also be noticed that the user activity has been low, however, the system usage has been high.
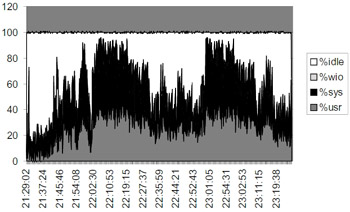
Figure 14.2: Unix sar report parsed through MS Excel tool.
There are several ways to identify CPU top sessions on a system; for example, by using the basic Unix ps command. The options used with the ps command will also be specific to the type of Unix being run on the server. In general, looking at the accumulated CPU time and the percentage of CPU time the processes are consuming, this is expressed as a percentage of total CPU resources.
ora-db2:RAC2:oracle # ps -ef -o pgid,time,pcpu,comm | sort -r -k 3| more PGID TIME %CPU COMMAND 0 16:48:20 0.8 fsflush 2139 09:16:42 0.3 /opt/SysShep4/perl/bin/perl 16163 03:43:34 0.2 oracleRAC2 7409 0:00 0.1 ps 15916 2:55 0.1 ora_smon_RAC2 2013 02:25:32 0.1 dlmd 0 0:00 0.0 vxnotify 15 1:26 0.0 vxconfigd 2094 0:11 0.0 sshd 7409 0:00 0.0 sort 26850 0:00 0.0 sh 0 0:04 0.0 sched 1558 0:00 0.0 rpc.ucmmstate 0 0:00 0.0 pageout 26343 0:00 0.0 oracleRAC2 11741 31:43 0.0 oracleRAC2 15918 0:00 0.0 ora_reco_RAC2
14.6.2 CPU from Oracle perspective
On a database server, running the ps command can yield program names which are fairly non-descriptive. Usually, the output as shown in the previous section would only be helpful to determine the Oracle instance that the process is running against. To relate Unix processes with the Oracle sessions, querying the V$SESSION table where the V$SESSION.PROCESS column equals the Unix process ID will provide a lead into the details. The SID and SERIAL# values can be selected from the V$SESSION table and used for further investigation inside the database to see which SQL statements are being executed by which user.
Starting with Oracle 9i, Oracle captures operating-system-level per formance statistics and stores them with other Oracle-related data. This data could be viewed using the Oracle-provided dynamic views. The query below provides a list of CPU-related information captured by Oracle:
SELECT STATISTIC#, NAME FROM V$STATNAME WHERE NAME LIKE '%CUP%' / STATISTIC# NAME ---------- ------------------------------------ 11 CPU used when call started 12 CPU used by this session 248 OS User level CPU time 249 OS System call CPU time 250 OS Other system trap CPU time
Using the above, one could query the Oracle instance and sort for the top Oracle CPU-consuming sessions independent of the activity at the Unix level. The users who are using the most CPU resources can be obtained using the following query:
COL NAME FORMAT A30 COL USERNAME FORMAT A20 SELECT VSN.NAME, VS.USERNAME, VSS.VALUE/600 "CPU(MIN)" FROM V$SESSTAT VSS, V$STATNAME VSN, V$SESSION VS WHERE VSS.STATISTIC#=VSN.STATISTIC# AND VS.SID=VSS.SID AND VSN.NAME LIKE '%CPU%' AND VSS.VALUE > 60000 GROUP BY VSN.NAME, VS.USERNAME, VSS.VALUE/600 / NAME USERNAME CPU(MIN) ------------------------- ---------- ---------- CPU used by this session MVALLATH 2191.69333 CPU used by this session SYSSHEP 164.24 CPU used when call started MVALLATH 2191.69333 CPU used when call started SYSSHEP 164.24
| Note | The CPU activity is also reported in the STATSPACK report under the instance activity area. |
From the above query, user MVALLATH is consuming most of the CPU. With the session, process, and user name information, the details of the activities could be obtained by determining the activities or queries that user MVALLATH had performed from the data gathered either from the STATSPACK snapshot taken during this period or if the database administrator has been collecting the V$SESSION_EVENT and V$SESSION_WAIT information as described in Chapter 13.
From the query executed by MVALLATH discussed in Chapter 13, a large number of consistent gets and physical reads were performed. Consistent gets are logical operations or reading data from memory (also called buffer gets). In Chapter 5, we discussed how Oracle stores the data in the buffer cache. Searching through the buffer table causes latch serialization. Latch serialization consumes CPU cycles. A latch is nothing but a lock in memory, to protect memory structures from concurrent access by multiple processes. Every time Oracle needs a latch, it is going to spin CPU cycles requesting and releasing locks. This is expensive, and when many queries have a similar behavior, it could take the system to its knees, showing 100% CPU utilization.
In this case and any time where queries show high LIO operations, every effort should be provided to tune these queries, either by rewriting the queries to be more efficient or by providing hints to help the optimizer to generate a better execution plan.
| Note | This query was probably not the only query being executed by the user during this period of high CPU utilization; however, it is just used as an example to explain one of the many causes. |
Another reason for high CPU utilization could be an insufficient number of latches available. This can be set by tuning the DB_BLOCK_LRU_LATCHES parameter. This parameter can be set to its maximum value of between 2 and 12 times the number of CPUs.
14.6.3 Analyzing disk I/O
Analyzing disk I/O from operating system
Disk I/O can be another area that needs some attention, especially during the initial configuration and testing. Monitoring disk I/O in a clustered environment provides information regarding the mount points and if the disks have been sliced across or have been partitioned vertically against one controller.
Oracle data files, based on the content of usage and how busy they get (based on user access patterns), need to be placed on controller or mount points that do not get affected by other data files and I/O activity from other such busy files.
The output below is an example of looking at I/O activity. The iostat utility provides disk, tape I/O activity and CPU utilization information.
ora-db2:RAC2:oracle # iostat –xpm extended device statistics device r/s w/s kr/s kw/s wait actv svc_t %w %b sd0,a 239.0 0.0 0.0 0.0 0.0 0.0 3.7 0 0 sd0,e 1392.0 1.4 0.0 1.7 0.0 0.0 6.3 0 1 sd0,g 0.0 0.0 0.0 0.0 0.0 0.0 0.0 0 0 sd1,c 202.5 0.0 0.0 0.0 0.0 0.0 292.0 2 0 sd1,g 0.0 1.4 0.0 1.7 0.0 0.0 6.7 0 1 ssd435,c 0.0 0.0 0.0 0.0 0.0 0.0 0.0 0 0 ssd435,d 0.0 4949.3 0.0 0.0 0.0 0.0 19.0 0 0 ssd435,e 0.0 0.0 0.0 0.0 0.0 0.0 0.0 0 0 ssd436,c 239.8 48.1 0.0 0.0 0.0 0.0 3494.0 4 0
-
device column provides the name of the disk for which statistic is listed.
-
r/s column indicates the reads per second from the device.
-
w/s column indicates the writes per second to the device.
-
kr/s column indicates the kilobytes read per second from the device.
-
kw/s column indicates the kilobytes written per second.
-
wait is the average number of transactions waiting for service. This indicates the queue length. actv is the average number of transactions actively being serviced.
-
The number indicates that the transactions are no longer in the queue and have not completed.
-
svc_t is the average service time, in milliseconds.
-
%w is the percentage of time there are transactions waiting for service.
-
%b is the percentage of time the disk is busy. Busy disks indicate that transactions are in progress on the disk.
From the output generated using iostat above, the service time is a good indicator of disk activity and disk response times. For example the following output
sd0,e 1392.0 1.4 0.0 1.7 0.0 0.0 6.3 0 1
indicates that there were 1392.0 disk reads per second and the service time was only 6.3 milliseconds. However, the following output
sd1,c 202.5 0.0 0.0 0.0 0.0 0.0 292.0 2 0 ssd436,c 239.8 48.1 0.0 0.0 0.0 0.0 3494.0 4 0
indicates that there were 202.5 disk reads per second with a service time of 292.0 milliseconds on disk sd1,c, which is a poor response time. Disk ssd436,c on the other hand shows 3494.0 milliseconds of service time with 4% wait for 239 disk reads and 48 disk writes, which is significantly on the high side, and should be classified as a hot disk. High service times could indicate that some of the most significantly used tables, indexes, etc., reside on this disk and need to be distributed to other disks to reduce I/O contention.
Analyzing disk I/O from Oracle
I/O activity in Oracle can be obtained either by using the STATSPACK report, where the I/O activity at the tablespace level and the I/O activity at the data file level are reported separately from each other, or by querying against the Oracle database directly.
Tablespace IO Stats for DB: PRODDB Instance: RAC1 Snaps: 3509 -3526 ->ordered by IOs (Reads + Writes) desc Tablespace --------------------------------- Av Av Av Av Buffer Av Buf Reads Reads/s Rd(ms) Blks/Rd Writes Writes/s Waits Wt(ms) ---------------- ----- ------- ------ ------- ------ -------- ------ ------ TEMP_OLTP 3,263 0 18.5 13.5 7,585 1 0 0.0 UNDO_RAC1 0 0 0.0 2,303 0 23 0.4 INDX_TBS3010_P001 0 0 0.0 562 0 263 41.1 USERS 55 0 8.9 1.0 166 0 1,706 28.7 SPACK_DATA_P001 15 0 9.3 1.0 135 0 0 0.0 ---------------- ----- ------- ------ ------- ------ -------- ------ ------ File IO Stats for DB: PRODDB Instance: RAC1 Snaps: ->ordered by Tablespace, File Tablespace Filename -------------------------------------------------------------------------- Av Av Av Av Buffer Av Buf Reads Reads/s Rd(ms) Blks/Rd Writes Writes/s Waits Wt(ms) ------------------ ------- ------ -------------- -------- ----- ------ DATA_TBS3004_P001 /dev/vx/rdsk/oraracdg/partition300m_59 17 0 1.8 1.0 56 0 0 DATA_TBS3008_P001 /dev/vx/rdsk/oraracdg/partition300m_61 0 0 64 0 0 INDX_TBS2007_P001 /dev/vx/rdsk/oraracdg/partition200m_7 4 0 7.5 1.0 1 0 3 16.7 INDX_TBS2008_P001 /dev/vx/rdsk/oraracdg/partition200m_8 0 0 9 0 0 INDX_TBS2009_P001 /dev/vx/rdsk/oraracdg/partition200m_9 0 0 5 0 0 INDX_TBS2010_P001 /dev/vx/rdsk/oraracdg/partition200m_60 6 0 6.7 1.0 9 0 0 INDX_TBS2011_P001 /dev/vx/rdsk/oraracdg/partition200m_10 6 0 10.0 1.0 8 0 0
Wait event statistics of the STATSPACK report are also a good source of information on I/O-related performance issues. For example, in the following extract of the STATSPACK report the I/O-related waits have been highlighted:
-> ordered by wait time desc, waits desc (idle events last) Total Avg Wait wait Waits Event Waits Timeouts Time(s) (ms) /txn ----------------------- ------- -------- -------- ---- ----- enqueue 17,618 1,775 3,442 195 0.5 log file sync 36,619 49 272 7 1.1 DFS lock handle 92,013 29 235 3 2.8 control file 4,659 0 53 11 0.1 parallel write log file parallel write 36,209 36,201 42 1 1.1 control file 18,309 0 35 2 0.6 sequential read PX Deq: Execute Reply 10,797 0 31 3 0.3 PX Deq: Parse Reply 13,099 0 30 2 0.4 PX qref latch 29 29 28 981 0.0 direct path read 2,625 0 26 10 0.1 PX Deq:Join ACK 13,793 6,592 26 2 0.4 SQL*Net more 164,396 0 10 0 5.0 data to client PX Deq: Signal ACK 3,990 1,357 10 3 0.1 PX Deq: reap credit 210,299 195,058 8 0 6.4 IPC send completion sync 6,707 0 8 1 0.2 buffer busy waits 289 0 5 18 0.0 db file parallel write 1,803 0 5 3 0.1 db file sequential read 424 0 4 9 0.0 direct path write 6,032 0 4 1 0.2 row cache lock 126 0 3 27 0.0 process startup 12 1 3 261 0.0 library cache lock 4,903 0 2 0 0.1 latch free 519 228 1 3 0.0 name-service call wait 4 1 1 304 0.0 SQL*Net break/ 240 0 0 2 0.0 reset to client KJC: Wait for 939 0 0 0 0.0 msg sends to client PXDeq Credit: send blkd 27 0 0 2 0.0 library cache pin 39 0 0 1 0.0 LGWR wait for redo copy 43 0 0 0 0.0 buffer deadlock 84 83 0 0 0.0 cr request retry 47 47 0 0 0.0 lock escalate retry 18 18 0 0 0.0 SQL*Net message 1,611,345 0 201,600 125 49.0 from client PX Idle Wait 33,509 26,541 72,502 2164 1.0 PX Deq: Execution Msg 28,974 1,101 7,113 246 0.9
Log file sync
This wait is encountered when a user session commits (or rolls back), and the session's redo information must be flushed to the redo log file by the LGWR. The server process performing the commit or rollback waits under this event for the write to the redo log to be completed.
This wait event occurs because of frequent commits, or because the I/O bandwidth is insufficient. If the case is one of frequent commits (average wait time is low but the number of waits is high), then consideration should be given to using batch commits, e.g., commits after every 50 inserts. If, how ever, I/O is the bottleneck, then with the help of a system administrator the I/O bandwidth of the system should be enhanced to deal with the load. One possible way is to ensure that the log files on spindles are isolated from other data files. In Chapter 2 (Hardware Concepts) there is some discussion around placing redo log files on RAID 1 to help improve write times.
Direct path write
Direct path write refers to the writing of buffers from PGA directly to disk as opposed to the background process, DBWR, writing them from the buffer cache to disk. Direct path writes happen in the following situations:
-
The PGA is too small and the sort has to be performed on disk, as opposed to in memory.
-
Parallel operations such as parallel DML, parallel create table as select, where the parallel slaves write data from PGA to disk.
Direct path inserts/Certain LOB operations
When a process makes a direct path write request, it waits on this event while the request is serviced. The reason for this wait event is an inadequately sized PGA and/or insufficient I/O bandwidth. Use the PGA advisor for tuning the PGA, and if this does not remedy the problem consider I/O bandwidth enhancement.
Direct path read
Direct path read implies that blocks are being read from disk directly into the PGA and not the SGA. This kind of read generally takes place in the following two situations:
-
Parallel queries are being performed where the query slaves are reading data directly into the PGA.
-
A large sort is being processed that cannot fit into the area allocated in the PGA for sorting. As a result, the sort has to be done on disk in the TEMP tablespace. After the sort is complete, the data is read back into PGA directly from disk.
Direct I/O has been enabled
A process that is attempting to read blocks into the PGA makes an I/O request call and then waits for the call to be serviced. This wait event indicates that data buffers are being processed faster than the I/O subsystem can read them into the PGA.
This event points to two possible problems, the PGA is too small, or the I/O subsystem is not sized adequately. This could be confirmed either through OEM or by querying V$PGA_TARGET_ADVICE. If the PGA is too small, then increasing the initialization parameter PGA_AGGREGATE_TARGET to the value recommended by the advisor would be helpful.
If the PGA advisor reveals that the PGA is appropriately sized, then the cause must be full table scans performing more parallel queries than the I/O subsystem can handle. Once again, the two possible remedies are reducing I/O workload or enhancing I/O bandwidth.
Buffer busy wait
This event occurs when two or more processes are trying to access the same buffer in the buffer cache. There are four types of buffer that may bein contention:
-
Segment data block buffer: Data block of a table or index.
-
Segment header buffer: Header block of a table or index.
-
Undo block buffer: Data block of a rollback (undo) segment.
-
Undo header buffer: Header of a rollback (undo) segment.
Not using AUM and/or automatic segment space management features of Oracle may be the reason for this wait event. Use of these features will help reduce contention for undo segments or their headers. Another possible reason for this wait event is the contention of the segment data block buffer, which is caused by indexes that are right-growing (this can happen when sequences are used to generate numbers being inserted), or by SQL statements performing large-range scans on indexes. The waits caused by sequence-generated indexes could be reduced by using reverse key indexes in a RAC environment.
If locally managed tablespaces are not used, then the symptom could be due to lack of free lists on tables that support many concurrent INSERT operations.
Latch free
A latch is a lock used by Oracle to protect memory structures. The latch free event occurs when a server process attempts to get a latch, but the latch is unavailable. There are different types of latches used for various purposes in Oracle. To resolve the problem of excessive latch free wait events, the type of latch being contended for has to be first identified, as the causes and remedy for the various types of latches are distinct. For example, tuning some of the parameters such as redo log buffer and redo copy latches help tune latch-related redo log files.
Shared pool or library cache latch
This latch can result in excessive waits due to unnecessary parsing of SQL statements. This can happen for several reasons, such as:
-
Statements not using bind variables.
-
Insufficient size of cursor cache.
-
Cursors being closed explicitly after each execution.
-
Frequent log-on/log-offs.
-
The shared pool being too small.
To alleviate the problem, consider the following in the order shown:
-
Tune the shared pool using the shared pool advisor from the OEM performance management screens or using the V$SHARED_POOL_ ADVICE dynamic performance view.
-
Set the initialization parameter CURSOR_SHARING =FORCE to force sharing of cursors among similar SQL statements not using bind variables.
Cache buffer LRU chain
This latch protects the lists of buffers in the buffer cache. It is acquired when modified (dirty) blocks are written to disk or when a server process is searching for blocks to write. Contention for this latch indicates excessive buffer cache throughput, such as cache-based sorts, inefficient SQL that accesses incorrect indexes (large index range scans), or many full table scans. When adding, moving, or removing a buffer from a list, a latch must be obtained.
Cache buffer chains
This latch is acquired when a user process tries to locate a block in the buffer cache. Contention for this latch indicates that multiple users are contending for the same blocks. Any resolution to this problem must include a reduction in contention for the same blocks. This can be achieved by tuning the SQL so that it performs fewer block accesses, and if this does not help, then by using a higher PCTFREE for the segment in question. This will mean that there are fewer rows per block in the segment, and therefore this makes it less likely that the blocks will have contention.
|
| < Day Day Up > |
|
EAN: 2147483647
Pages: 174