14.2 Methodology
|
| < Day Day Up > |
|
Problem-solving tasks of any nature need to be approached in a systematic and controlled manner. There needs to be a defined procedure or an action plan and this procedure needs to be followed step-by-step from start to finish. During every step of the process, data is collected and analyzed, and the results are fed into the next step, which in turn is performed in a similar step-by-step approach. Hence methodology is the procedure or process followed from start to finish, from identification of the problem to problem solving and documentation. A methodology is a procedure or process that is repeatable as a whole or in increments through iterations.
During all of these analysis steps, the determination of the cause or reasons for a behavior or problem should be based on quantitative analysis and not on guesswork.
The performance tuning methodology can be broadly categorized into seven steps:
-
Problem statement
-
Information gathering
-
Area identification
-
Area drilldown
-
Problem resolution
-
Testing against baseline
-
Repeating the process
While each of the above steps is very broad, a methodical approach will help identify and solve the problem in question, namely performance.
Which area of the system is having a performance problem? Where do we start? Should the tuning process start with the operating system, network, database, instance, or the application? Obviously it is the users of the application tier that are complaining that the system is slow. Users access the application, and the application through some kind of persistence layer communicates to the database to store and retrieve information. However, when the user who made the request does not get the response to the request in a sufficiently fair amount of time, they complain that the system is slow.
Well, this method will help provide a well-performing application system. However, certain iterations may have to be performed from bottom up. That is, starting with the hardware platform, tuning the storage subsystem, tuning the database configuration, tuning the instance, etc. Addressing the tuning issue using this approach could bring some amount of change or performance improvement to the system with less or no impact to the actual application code. However, if the application is poorly written, it does not matter how much tuning is done at the bottom tier, the underlying issue will remain the same.
14.2.1 Getting to the obvious
The application tier could be a very broad area and could have many components, all components communicating through the same persistence layer to the Oracle database. In order to get to the bottom of the problem, namely performance, each area of the application needs to be examined and tuned methodically. To differentiate the various components, the application needs to be divided into smaller areas.
14.2.2 Divide into quadrants
One approach towards a very broad problem is to divide the application into quadrants, starting with the most complex area in the first quadrant (most of the time the most complex quadrant or the most commonly used quadrant is also the worst-performing quadrant), followed by the area that is equally or less complex in the second quadrant, and so on. However, depending on how large the application is and how many areas of functionality the application covers, these four broad areas may not be sufficient. If this were the case, the next step would be to break each of the complex quadrants into four smaller quadrants (subquadrants) or functional areas. This second level of breakdown does not need to be done for all the quadrants from the first level and can be limited to only the most complex ones. After this second level of breakdown, the most complex or the worst-performing functionality of the application that fits into the first quadrant is selected for performance testing.
Following the methodology listed above, and through an iterative process, each of the subquadrants and the functionality described in the main quadrant will have to be tested. Starting with the first quadrant, the various areas of the application will be tuned, and when the main or more complex or most frequently used component has been tuned, the next component in line is selected and tuned. After all the four quadrants have been visited, the process starts all over again. This is because after the first pass, even though the findings of the first quadrant were validated against the components in the other quadrants, when performance of all quadrants improves, the first quadrant continues to show performance degradation and probably has room to grow.
Figure 14.1 illustrates the quadrant approach to dividing the application for a systematic approach to performance tuning. The quadrants are approached in a clockwise pattern with the most critical or worst-performing piece of the application occupying quadrant 1.
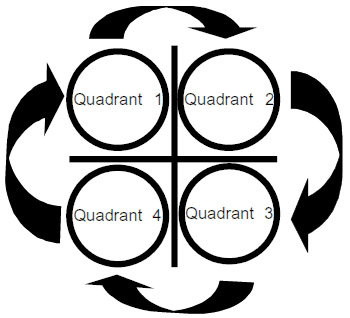
Figure 14.1: Dividing into quadrants.
While intensive tuning may not be the goal through every iteration, each quadrant, based on the functionality supported and the amount of processing combined with the interaction with other tiers, may have room for further tuning or may have areas that are not present in the component of the first quadrant and hence may be a candidate for further tuning.
Now that we have identified which component of the application needs immediate attention, the next step would be, where do we start? Obviously the most important piece is where the rubber meets the road. Hence in the case of an application that interacts with the database, the first step would be to look into the persistence layer.
In the previous section, we discussed taking a bottom-up approach. This may be an alternative if the database administrator or the performance engineer suspects that the underlying storage subsystem is where the problem resides.
From a database tuning perspective, the persistence layer would be the first layer to which considerable attention should be given. However, areas that do not have any direct impact on the database such as application partitioning, looking at the configuration of the application server (e.g., WebLogic, Oracle 9i AS, WebSphere, etc.[1]), tuning the various parameters of the application tier such as the number of connections, number of threads or queue sizes of the application server, are all areas that could also be addressed. However, in the context of this chapter the discussion will be focused around the database and the layers that interact with the database.
The persistence layer is the tier that interacts with the database and comprises SQL statements, which communicate with the database to store and retrieve information based on users' requests. These SQL statements depend on the database, its tables, and other objects that it contains, and store data to respond to the requests.
In the previous chapter, the various utilities and tools of tuning SQL statements such as EXPLAIN PLAN, SQL Trace and the event interface were discussed. With the help of the SQL Trace or the event interface, all SQL statements executed through the various quadrants could be captured and profiled. These statements could be individually examined and tuned on an ongoing basis and a matrix could be developed, providing a trend of improved or degraded performance.
During a controlled load testing, the database statistics captured using various tools such as the STATSPACK provide insight into the worst- performing SQL queries. The STATSPACK utility discussed in Chapter 13 also provides other statistics as indications of why the database is performing or responding poorly.
[1]WebLogic is a product owned by BEA Systems; WebSphere is a product owned by International Business Machines and Oracle 9i AS is a product owned by Oracle corporation.
|
| < Day Day Up > |
|
EAN: 2147483647
Pages: 174