Lesson 1: System Maintenance and Monitoring
Lengthy client response times, delays in message delivery, unnecessary nondelivery reports, and frequent unavailability of the messaging system can frustrate users. Ongoing system monitoring cannot prevent trouble, but it can allow you to discover problems as quickly as possible. If you use the maintenance tools of Exchange 2000 Server extensively, you can most likely resolve most problems before users become aware of them. Even if you cannot solve a problem immediately, it is better to be informed before the first user starts to complain.
This lesson deals with powerful maintenance features of Exchange 2000 Server. It explains how to configure a server for recovery of deleted items without immediate need for a backup. It also explains how to use server monitoring and how to examine pathways that messages have taken across your organization.
At the end of this lesson, you will be able to:
- Configure deleted items retention times.
- Monitor servers and check link and system states.
- Use the Message Tracking Center to verify that messages are delivered properly.
- Force the Active Directory replication to propagate changes as quickly as possible.
Estimated time to complete this lesson: 90 minutes
Deleted Items Retention
Exchange 2000 Server allows you to configure your mailbox and public stores to retain deleted items for a specified period of time. Within that time frame, accidentally deleted items can be recovered quickly without the need for backup. This advantageous feature is known as deleted items retention.
It is a very good idea to specify an appropriate retention time for each store in its Limits tab using the Keep Deleted Items For (Days) and Do Not Permanently Delete Mailboxes And Items Until The Store Has Been Backed Up settings. Seven days is usually an appropriate time frame. Using Microsoft Outlook 2000, users can retrieve deleted items as long as they are still in the store by selecting the Deleted Items folder, opening the Tools menu, and then clicking Recover Deleted Items. This will display the Recover Deleted Items From - Deleted Items window, where desired messages can be selected. Clicking the Recover Selected Items button in the toolbar transfers selected items back into the Deleted Items folder. From there, the messages can be moved into other folders as if the Wastebasket has not been emptied.
A remarkable new feature is the retention of deleted mailboxes. With Exchange 2000 Server, accidental mailbox deletions are a problem of the past. By default, deleted mailboxes are retained for 30 days. Within this interval, you can reconnect mailboxes to the same or different user accounts without difficulty using Exchange System Manager. You can specify a different number of days in the Limits tab for mailbox stores using the Keep Deleted Mailboxes For (Days) setting.

Exercise 1: Recovering a Deleted Mailbox
In this exercise you will recover a mailbox that was (almost) accidentally deleted. You will work with the Exchange 2000 Server Cleanup Agent and the Reconnect feature of Exchange System Manager.

To view a multimedia demonstration that displays how to perform this procedure, run the EX1CH20*.AVI files from the \Exercise_Information\Chapter20 folder on the Supplemental Course Materials CD.
Prerequisites
- Completed Exercise 1 of Chapter 14, "Managing Server Configuration."
- Restart BLUESKY-SRV2 and BLUESKY-WKSTA, and make sure they are operational.
- Log on as Administrator to all machines.
To reconnect a deleted mailbox to a Windows 2000 user account
- On BLUESKY-SRV2, launch Active Directory Users and Computers from the Microsoft Exchange program group.
- Open the Users container, right-click the Administrator account, and select Exchange Tasks.
- On the welcome screen of the Exchange Task Wizard, click Next.
- On the Available Tasks wizard screen, select Delete Mailbox, and then click Next twice to delete the mailbox.
- On the final wizard screen, verify that the mailbox was successfully deleted, and click Finish.
- Launch Exchange System Manager, and expand all administrative groups and servers.
- Under BLUESKY-SRV2, expand Management Group, then VIP Mailboxes, and then select Mailboxes. The Administrator mailbox is displayed as normal.
- Right-click Mailboxes, and select Run Cleanup Agent. The Administrator mailbox is now displayed as a deleted mailbox (see Figure 20.1).
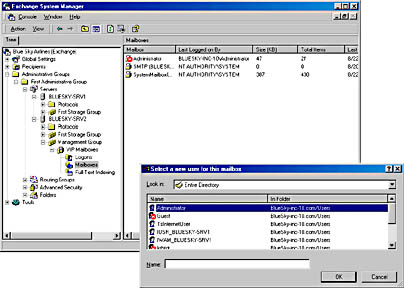
Figure 20.1 Reconnecting a deleted mailbox
- On BLUESKY-WKSTA, launch Outlook 2000. You will not be able to work with your mailbox because it was deleted. In the Microsoft Outlook dialog box informing you that the default e-mail folders cannot be opened, click OK. In the next Microsoft Outlook dialog box, click No to exit Outlook without opening the default file system folders.
- In Exchange System Manager on BLUESKY-SRV2, right-click Administrator, and select Reconnect.
- In the Select A New User For This Mailbox dialog box, select Administrator, and click OK. In the Reconnect dialog box, click OK.
- If an Exchange System Manager dialog box appears informing you that the object has not been replicated to the destination server yet, click OK.
- Wait for the Recipient Update Service to assign the Administrator account valid e-mail addresses. Switch to Active Directory Users and Computers, double-click the Administrator account, click on the E-Mail Addresses tab, and verify that e-mail addresses are assigned. Click OK.
- Switch back to Exchange System Manager, right-click Mailboxes again, and select Run Cleanup Agent. Notice that the mailbox is now reactivated.
- On BLUESKY-WKSTA, launch Outlook 2000, and verify that you connect to your mailbox as usual and messages have not been lost.
Exercise Summary
The Exchange 2000 Server Cleanup Agent would run typically at database maintenance intervals to check for deleted mailboxes. Deleted mailboxes are not immediately removed but marked as disconnected. By default, the Cleanup Agent purges them after 30 days. For recovery, they are retained as defined by the Keep Deleted Mailboxes For (Days) parameter. Disconnected mailboxes are easy to recover without the need for a backup. Right-click on the mailbox, click Reconnect, then select the desired user account, and your job is done. Users can work with reconnected mailboxes immediately.
System Monitors as Maintenance Tools
A system monitor periodically checks all specified resources. When these are available and operating below a specified threshold, the system is considered active, but as soon as one of the monitored resources is detected as problematic, the system enters a warning or critical state. In this situation, the link state information (LSI) of the affected server is updated, the routing group master is informed, and the new system state is eventually propagated to all servers in the organization. The propagation of LSI was explained in Chapter 16, "Message Routing Administration."
When LSI indicates a serious system state, Exchange 2000 Server can perform specific actions such as launching a process or sending notification messages that you need to define beforehand. In other words, system monitoring can keep you updated about the state of your servers and messaging connectors at all times. System monitoring can also be used in conjunction with the Services snap-in. Notifications inform you about encountered problems, and the Services snap-in allows you to specify immediate actions, such as restarting services or rebooting the server automatically. The Services snap-in was introduced briefly in Chapter 12, "Management Tools for Microsoft Exchange 2000 Server."
Configuring Monitored Services and Resources
Per server, you can specify which resources to monitor. By default, the following services are checked: Microsoft Exchange Information Store, Microsoft Exchange MTA Stacks, Microsoft Exchange Routing Engine, Microsoft Exchange System Attendant, Simple Mail Transfer Protocol (SMTP), and World Wide Web Publishing Service. If any of these services is not running, the server enters the critical state. It is possible to add further services to the list using Exchange System Manager. Display the properties of the desired server object, and click on the Monitoring tab.
Besides services, it is also possible to monitor system resources, such as the available virtual memory, the CPU utilization, free disk space, or the growth of message queues. You can add monitor counters for these categories to your server by clicking on the Monitoring tab and then the Add button. It is advisable to monitor the free disk space on the server, for instance. Exchange 2000 Server shuts down important services if less then 10 MB are available on the drive, but you should not wait until that happens before taking action. Exchange experts prefer to keep half or more of the drives, where mailbox and public store databases have been placed, free. This space can be used for database compaction or offline repair of crashed databases. You can read more about low-level database utilities and offline database maintenance in Lesson 2.
Configuring Notifications
Nothing happens when a server enters the warning or critical state until you configure appropriate notifications. To configure a notification, launch Exchange System Manager, expand Tools in the console tree, and expand Monitoring And Status. Right-click Notifications, point to New, and select E-mail Notification or Script Notification. For both types, you need to specify a monitoring server. You should specify a remote Exchange 2000 server within the same routing group for the purposes of monitoring warning and critical states. If the monitored server goes down, it can no longer send notifications. If the monitoring server resides in a remote routing group, a broken routing group connector may prevent the propagation of LSI and changes of warning, or critical states may not be detected in a timely manner. LSI limitations are discussed later in this section.
For e-mail notifications, you need to enter recipient information, subject, and message text. Standard subject and body consist of a number of Windows Management Instrumentation (WMI) placeholders, which you can modify if desired. More often than not, the standard notification text will be sufficient. You must also identify an e-mail server. This computer should be an internal system because you need to allow anonymous relay through the specified host. Script notifications, on the other hand, expect you to define a command line instead of message parameters to launch the desired program. The security risks of anonymous relay through public SMTP systems were discussed in Chapter 15, "SMTP Transport Configuration."
NOTE
In each server's Monitoring tab (view the properties of the server and click on the Monitoring tab), you will find a Disable All Monitoring Of This Server check box. Select this check box before shutting down services for maintenance. This switches the system state into maintenance mode to prevent the generation of warning and critical state notifications.
Link and System States
If you have been informed that a system has entered a warning or critical state, it is a good idea to get a quick, detailed overview of the situation. First, check the state of connectors and servers using Exchange System Manager. Select the Status container in the console tree, which you can find in the Monitoring And Status container within Tools, to display the LSI of connectors and servers in the details pane. As soon as you have identified a problematic component, check the affected server's application event log—provided that the server is still available. The Event Viewer is able to display event logs from remote computers. Right-click the root object Event Viewer (Local), and select Connect To Another Computer. If you do not find useful hints in the application event log, you may increase the diagnostic logging level of concerned components, as outlined in Chapter 14, "Managing Server Configuration."
Limitations of State Information and System Monitoring
When working with system state information and system monitoring, you need to be aware of several limitations that result from the fact that this feature is based on LSI. System states are logged per server in the corresponding User Data field. You can check this field using the Winroute utility. Launch WINROUTE.EXE from the \Support\Utils\i386 directory on the Exchange 2000 Server CD and connect to your server (such as BLUESKY-SRV1). Under the organization object (for example, Organization Name: Blue Sky Airlines), open the desired routing group (for example, RG: First Routing Group [First Administrative Group]), and expand RG Members, then expand the server object that you are interested in (for example, BLUESKY-SRV1), and then check for User Data. A trouble-free server shows a value that begins with 0701. If the system is in warning state, the value begins with 0702. A critical state is indicated by 0703. In contrast, if you have switched the server into maintenance mode, User Data is set to 0781000000000000. It is perhaps easier to analyze LSI in Exchange System Manager.
The following restrictions apply to system monitoring:
- Clustered servers cannot be monitored because their services do not directly relate to Windows 2000 services. As outlined in Chapter 7, "Microsoft Exchange 2000 Server in Clustered Environments," clustered services must be controlled using Cluster Administrator.
- If you are monitoring servers across routing groups, you need to make sure routing group connectors are functioning to propagate updated LSI. Do not forget to configure notifications for routing group connector states because broken connectors can prevent the propagation of LSI to the monitoring server.
- In Exchange 2000 Server all services start even if databases have been damaged. A running server does not imply that databases are in a consistent state.
- LSI and system monitors rely on the System Attendant service and the Microsoft Exchange Routing Engine and cannot function if these services are not started. In other words, the server status will not be accurate unless System Attendant and Routing Engine are running.
- Only routing group connectors (that is, Routing Group Connectors, SMTP Connectors, and X.400 Connectors) support LSI. The status of gateway connectors, such as the Lotus Notes Connector, will always be marked as Up, whether the corresponding service is started and functioning or not.
- When using Exchange 2000 Server in a mixed organization with earlier versions, do not use Exchange Server 5.5 Server or Link Monitors to check the state of Exchange 2000 servers.
Exercise 2: Configuring System Monitor Notifications
In this exercise you will configure monitored system resources and define a threshold when the server enters the critical state. You will then configure an e-mail notification and test the configuration.
To view a multimedia demonstration that displays how to perform this procedure, run the EX2CH20*.AVI files from the \Exercise_Information\Chapter20 folder on the Supplemental Course Materials CD.
Prerequisites
- Restart BLUESKY-SRV1, BLUESKY-SRV2, and BLUESKY-WKSTA, and make sure they are operational.
- Log on as Administrator to all machines.
- Make sure the Administrator mailbox exists on BLUESKY-SRV2.
To configure a system monitor e-mail notification
- On BLUESKY-SRV1, launch Exchange System Manager, and expand the default administrative group and servers.
- Under BLUESKY-SRV2, open the Protocols container, expand SMTP, right-click Default SMTP Virtual Server, and select Properties.
- Click on the Access tab, and then click Relay.
- Select the All Except The List Below option, make sure the list is empty, and click OK twice to close all dialog boxes. The configuration of SMTP virtual servers was covered in Chapter 15, "SMTP Transport Configuration."
- Right-click BLUESKY-SRV1 and select Properties.
- Click on the Monitoring tab, click Add, double-click Free Disk Space, and in the Disk Space Thresholds dialog box, enable the Warning State (MB) check box.
- In the corresponding text box that is now available, type 1024, and then click OK.
- Click the newly created entry, and verify that the Currently Available Drive Space (MB) is below 1024 MB (see Figure 20.2). Otherwise, adjust the settings to specify a value higher than the available disk space to force the monitor to detect a warning state.
NOTE
All resources (that is, Virtual Memory, Free Disk Space, SMTP Queue Growth, X.400 Queue Growth) display current system values in their configured monitors. - Click OK twice to close the dialog boxes.
- In the console tree, open Tools, expand Monitoring And Status, and select Status. Verify that BLUESKY-SRV1 has entered the Warning State and that the Status column indicates that the Disk Space threshold was exceeded (see Figure 20.2). You may need to press F5 to refresh the display.
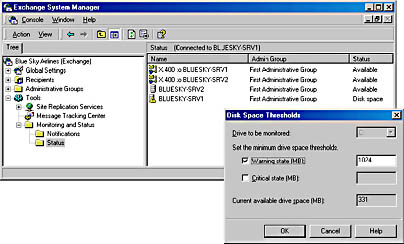
Figure 20.2 Configuring a disk space monitor
- Right-click Notifications, point to New, and select E-Mail Notification.
- In the Properties dialog box, click Select, and in the Select Exchange Server dialog box, double-click BLUESKY-SRV2.
- Under Servers And Connectors To Monitor, select All Servers.
- Click To, and in the Select Recipient dialog box, double-click Administrator.
- Leave all other settings at their default (see Figure 20.3), and click OK.
- Allow time for the Active Directory replication to propagate the newly created components to BLUESKY-SRV2. The replication may take approximately five minutes. On BLUESKY-SRV1, you may load the Exchange System snap-in in a customized management console to connect to BLUESKY-SRV2 explicitly. When the new notification object is visible in the Notifications container on BLUESKY-SRV2, stop the World Wide Web Publishing Service on BLUESKY-SRV1 using the Services snap-in.
- Switch back to Exchange System Manager, select the Status container, and verify that BLUESKY-SRV1 has entered the critical state.
- On BLUESKY-WKSTA, launch Outlook 2000, make sure you are connected to the Administrator mailbox, and wait until a notification message arrives. Open the message and check originator and message details.
- Close the e-mail notification and Outlook 2000.
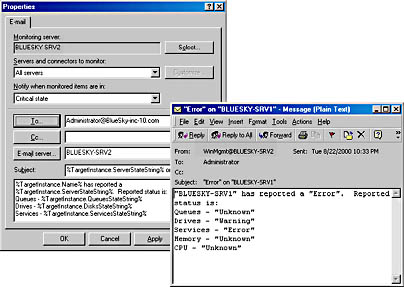
Figure 20.3 Configuring an e-mail notification for critical system states
Exercise Summary
System monitoring is a maintenance utility that should be used extensively. Monitors can warn you before critical states are reached, putting you one step ahead of your users and allowing you to fix many problems before they are noticed. It is a good idea to use multiple machines in each routing group as monitoring servers for warning and critical state notifications.
Using the Message Tracking Center
Message tracking is a feature that allows you to follow the paths of messages as they travel through your organization. All messages routed through the transport engine of a server that is enabled with message tracking are added to the tracking logs. Message tracking is disabled by default. It is possible to activate message tracking per server on the server's General tab or in a server policy. You enabled it for all servers in your test environment in a server policy during Exercise 2 of Chapter 12, "Management Tools for Microsoft Exchange 2000 Server."
Message tracking enables you to do the following:
- Locate specific messages in message queues.
- Verify that a message has been delivered successfully.
- Determine delays on each segment of a route for performance tuning.
Message Tracking Log Files
With message tracking enabled, status information is written to daily log files, which are stored in the \Program Files\Exchsrvr\<servername>.log directory (for example, \Program Files\Exchsrvr\BLUESKY-SRV1.log). Their file name follows the scheme <YYYYMMDD>.LOG (for example, 20001015.LOG). Tracking log files are shared on all Exchange 2000 servers as <SERVERNAME>.LOG for everyone in the domain. You should replace the Everyone group in the access control list with the accounts of those administrators that are supposed to track messages, as mentioned in Chapter 19, "Implementing Advanced Security."
Using Message Tracking
You can analyze tracking information conveniently in the Message Tracking Center. It is also possible to view the information in a text editor. The Exchange Message Tracking Center is available as a stand-alone snap-in and an extension snap-in integrated with Exchange System Manager, where you can find it in the console tree under Tools. The Message Tracking Center reads tracking information from the network shares of each server that has been involved in a particular message transfer. You must specify which server to begin with in the Message Tracking Center dialog box that appears when you right-click the Message Tracking Center container and select Track Message (see Exercise 3, in this chapter).
Message tracking log files are tabulator-separated text files that can also be analyzed in Microsoft Excel. This is useful if you want to quickly check whether a particular message has made its way across the organization to the recipient, but you are currently working on a workstation where the Exchange System Management Tools have not been installed. Table 20.1 lists the header fields in chronological order.
Table 20.1 Header Columns of Tracking Logs
| # Date | Time | Client-IP | Client-Hostname |
|---|---|---|---|
| Partner-Name | Server-Hostname | Server-IP | Recipient-Address |
| Event-ID | MSGID | Priority | Recipient-Report-Status |
| Total-Bytes | Number-Recipients | Origination-Time | Encryption |
| Service-Version | Linked-MSGID | Message-Subject | Sender-Address |
NOTE
Message tracking is supported as long as the <SERVERNAME>.LOG shares of the servers are reachable and foreign messaging systems are not involved in the message transfer (see Figure 20.4).
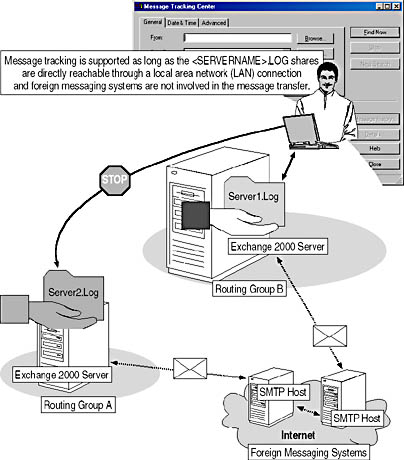
Figure 20.4 Message tracking across servers and its boundaries
Exercise 3: Tracking Messages Across the Organization
In this exercise you will use the Message Tracking Center to examine the path a particular message has taken across your test environment. You will send a message between two Exchange 2000 servers.
To view a multimedia demonstration that displays how to perform this procedure, run the EX3CH20*.AVI files from the \Exercise_Information\Chapter20 folder on the Supplemental Course Materials CD.
Prerequisites
- Restart BLUESKY-SRV1, BLUESKY-SRV2, and BLUESKY-WKSTA, and make sure they are operational.
- Log on as Administrator to all machines.
- Make sure the Administrator mailbox exists on BLUESKY-SRV2.
To check out the capabilities of the Message Tracking Center
- If you have not enabled message tracking in a system policy according to Exercise 2 of Chapter 12, "Management Tools for Microsoft Exchange 2000 Server," launch Exchange System Manager on BLUESKY-SRV2, expand Administrative Groups, expand First Administrative Group, and then expand Servers. Right click BLUESKY-SRV2 and select Properties. In the General tab of the Properties dialog box, select the Enable Message Tracking check box.
- On BLUESKY-WKSTA, launch Outlook 2000, make sure you are connected to the Administrator mailbox, and send a test message to Carl Titmouse. After that, close Outlook 2000.
- On BLUESKY-SRV2, launch Exchange System Manager, expand Tools, right-click Message Tracking Center, and then select Track Message.
- In the Message Tracking Center dialog box, under Server(s), click Browse.
- Double-click BLUESKY-SRV2 and then click OK.
- In the Message Tracking Center dialog box, click Find Now. If an Exchange System Manager dialog box appears informing you that some log files cannot be found, click Yes. This is normal because the complete history of tracking logs may not be available if you have just recently enabled message tracking.
- In the Message Tracking Center dialog box, you will see the message to Carl Titmouse (see Figure 20.5). Click on the last message in the list with Carl Titmouse as Recipient.
- In the Message History dialog box, examine the message details, and then under Message History, follow the path the message has taken into the mailbox store of Carl Titmouse.
- In the Message History dialog box, click Save to save the history of this message in a text file. Under File Name, type Tracked Message, and click Save.
- Click Close twice to close the Message History dialog box and the Message Tracking Center.
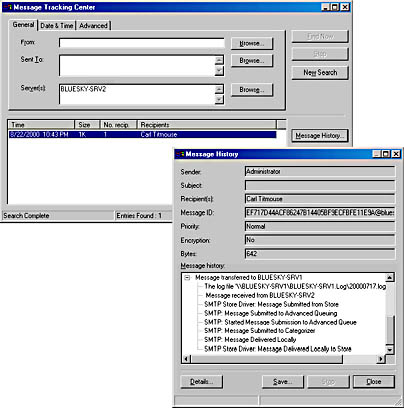
Figure 20.5 Using the Exchange Message Tracking Center
Exercise Summary
Message tracking is a helpful feature if you need to examine the path a message has taken from server to server in your organization. For instance, if a user denies having received a particular message, or if another user complains about apparently lost messages, message tracking can verify where messages have ended up. You can search by originator's e-mail address (From), recipient's e-mail address (Sent To), servers involved in message transfer (Server[s]), specific date information (Date & Time tab), as well as advanced properties, such as the message ID (Advanced tab). You can save message histories to text files for later reference or to preserve this information. Tracking logs are deleted according to the setting specified under Remove Files Older Than (Days) for Log File Maintenance, which you can find in each server's General tab as well as in server policies.
Using Message Queues for Troubleshooting
It is advisable to check the message queues of an Exchange 2000 server frequently to verify that the system is functioning properly. Too many backlogged messages can indicate a configuration or performance problem.
Checking SMTP-Based Message Queues Manually
Every SMTP virtual server provides a subcontainer called Queues that allows access to system and connector queues. While the system queues are always displayed (that is, queues for local delivery, for messages awaiting directory lookup, and messages waiting to be routed), connector queues are displayed only when messages are present. You may want to check these queues when configuring new connectors. To test a new Routing Group Connector, for instance, send test messages to a remote recipient. If these messages remain in the local queues, the connector settings require an adjustment.
NOTE
The Windows 2000 SMTP service must be running and remote procedure calls (RPCs) between Exchange System Manager and the SMTP service must work; otherwise, you cannot examine SMTP-based message queues.
Deleting and Freezing Messages
If you suspect that a displayed message is blocking a queue, you can delete it by right-clicking on it and selecting Delete (Send NDR) or Delete (No NDR), depending on whether you want to inform the originator about the deletion or not. Similar to the way messages are deleted, you can freeze and unfreeze message items. Selecting the Freeze command keeps a message in the queue until you unfreeze it.
You can delete individual messages, a filtered subset of messages, or an entire queue. To define a filter, right-click the desired queue, and then select Custom Filter. Select the desired action, such as Delete (Send NDR) or Delete (No NDR) from the Action list box. To delete all messages without filtering, on the other hand, right-click on the desired queue, and select Delete All Messages (Send NDR) or Delete All Messages (No NDR) right away. Similarly, you can select Freeze All Messages and Unfreeze All Messages.
Checking SMTP-Based Message Queues Automatically
System Monitor allows ongoing monitoring of SMTP-based messages. Display the properties of your server, click on the Monitoring tab, click Add, and double-click SMTP Queue Growth. You can define a period of time for the warning and the critical state. When the queue grows continuously for the specified interval, Exchange 2000 Server can send you a notification message, as illustrated in Exercise 2. In this way, you will be able to detect performance problems without delay. You might upgrade network connections as required, or configure additional connectors to different bridgeheads, as explained in Chapter 16, "Message Routing Administration."
It is also possible to observe the state of the SMTP service in the Windows 2000 Performance tool. Select the performance object called SMTP Server, and choose from the available counters as appropriate, such as Avg Retries/Msg Sent, which may reflect the quality of your communication link. Using the Performance tool, you can create reports over a longer period of time to gather statistical data about the performance of your system.
Checking X.400-Based Message Queues
It is also possible to work with X.400-based queues. This is required if you have deployed X.400 Connectors to remote routing groups or foreign messaging systems. The Message Transfer Agent (MTA) of Exchange 2000 Server is also responsible for message routing to gateway connectors, such as the Connector to Lotus cc:Mail or Novell GroupWise. Consequently, you will find corresponding X.400-based message queues for these connectors if you have installed them. Gateway connectors are covered in Chapters 25 through 29.
The X.400-based Queues container can be found under the X.400 Protocol container. The Microsoft Exchange MTA Stacks service must be running; otherwise, the queue contents are not displayed. When checking message queues from a remote workstation, RPCs must be supported.
You can monitor the growth of X.400-based message queues as well. In the Monitoring tab of your server, click Add, and double-click X.400 Queue Growth. The parameters are the same as those for SMTP-based message queues. It is also possible to monitor X.400-based message queues using the Performance tool when adding performance counters of the MSExchangeMTA or MSExchangeMTA Connections objects to charts and reports. Gateway connectors will provide additional performance objects for detailed analysis and statistics.
The MTA Check Utility
The MTA is an important component responsible for communication over X.400 Connectors and gateways to foreign messaging systems. This component maintains its message queues in .dat files, which can be found in the \Program Files\Exchsrvr\Mtadata directory. Several of these .dat files are installed during setup and represent important MTA message queues. Others are created during message conversion. Temporary .dat files represent the actual contents of messages that are currently located in an MTA message queue. A few moments later, when the MTA has processed the messages, the related .dat files disappear again.
Fixing MTA Startup Problems
Unfortunately, .dat files can become corrupted just like any other file on a computer's hard disk—during a system crash, for instance. If this happens, you may experience MTA startup difficulties. In this situation, check the application event log for message queue corruption and other MTA-related log entries. If you do find indications of corrupt files, consider using the Mtacheck utility to fix the problems. The Mtacheck utility is a command-line tool that provides several helpful options. Use the command line Mtacheck /? within the \Program Files\Exchsrvr\Bin directory to display a short help file about available parameters. To use the Mtacheck utility, you need to stop the Microsoft Exchange MTA Stacks service.
Forcing Active Directory Replication
Active Directory directory service management is, strictly speaking, not the task of the Exchange 2000 administrator. However, if you have the required administrative Windows 2000 permissions, you can force Active Directory replication using the Active Directory Sites and Services snap-in. This is useful if you want to replicate configuration changes quickly across your forest.
Pulling Configuration Changes
Active Directory replication is a pull process. The server that has configuration changes to propagate informs remote servers about the changes but does not push them into its neighbors. If you plan to initiate this manually, you need to pull changes to target servers instead of pushing the data from the source server. In Active Directory Sites and Services, expand the Sites in the console tree, expand the container that represents the site of the target server (that you want to synchronize), expand the Servers container, then the target server, and then select NTDS Settings. In the details pane, right-click the desired replication connector object, and then select Replicate Now. This initiates the replication of configuration changes from the source server.
EAN: N/A
Pages: 186