181.
| [Cover] [Contents] [Index] |
Page 260
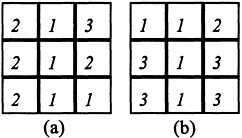
Figure 6.16 The logit model fit method (Dubes and Jain, 1989). The two different configurations can be treated as the same group as Figure 6.15b because they each output ψ(wr0,wNr)=[2, −2, 0, 0].
6.4.2 Results of parameter estimations
Three test images, each of size 256×256 pixels, shown in the left-hand column of Figure 6.17, are subjected to parameter estimation experiments using the logit model fit method described in Section 6.4.1. The specified and estimated parameters are shown in Table 6.1. The images generated by these estimated parameters are shown in the right-hand column of Figure 6.17. As seen from Table 6.1, although the estimates are not numerically good in rows 2 and 3, the images generated by the specified and estimated parameters yield a visually similar realisation (Figure 6.17).
The results of parameter estimation are mainly affected by two factors, namely, the number of equations being used and the image size. As described in Section 6.4.1, the results of parameter estimation tend to fluctuate considerably when different numbers of equations are used. We carried out a number of experiments, and concluded that the appropriate number of equations is case-dependent. If too few or too many equations are used then unacceptable estimates will result. There is a lack of clear rules for coping with this issue (although Derin and Elliott (1987) suggest one should choose the equations containing large probabilities, how large the probability should be is not clear, and is obviously case-dependent).
The second issue concerns image size. If the image size is not sufficiently large, then probabilities derived using histogram based techniques (see Equation (6.46)) will be biased and thus yield unsatisfactory parameter estimates. In order to generate reliable probability estimates using the histogram technique, we suggest that the image size should not be smaller than 256×256 pixels.
6.5 MAP-MRF classification algorithms
Once the posterior energy and the associated parameters have been determined, the next step is to determine a solution. As noted previously, based on the Bayesian formulation, the criterion for pixel labelling is to find the
| [Cover] [Contents] [Index] |
EAN: 2147483647
Pages: 354