Resource Management
The Network Load Balancing Service as described at the beginning of this chapter ensures that user sessions are shared out as evenly as possible between all the terminal servers available in a farm. Analyses of server resource utilization might guarantee the proper adjustment of the balancing algorithm, but the analyses are almost always based on a moment-in-time consideration of system load at the time of a connection request by a new user. But how can the scalability of a terminal server environment be increased further? How can you prevent one user using so much of the terminal server resources that other users are put at a major disadvantage ? How can logical resources, such as a time zone or license server, be modified differently depending on the location of the user or server without the need for complicated system intervention? The following section aims to answer these questions.
Windows System Resource Manager
The utilization of a terminal server in large-scale environments can only be described through statistics. In a farm with 100 terminal servers, each with 100 applications installed and with 5000 potential users altogether, there will be a resulting standard resource utilization profile that represents an average value. But this is only statistics. Someone might be unlucky and might get logged on to a terminal server with many power users who just happen to be relatively inactive at that particular moment when the load balancer selected the server. Equally, someone might be unlucky when, another interactive user, sharing the same relatively lightly utilized terminal server, might launch an application that is particularly uncooperative, tying up a large amount of server resources. In either case, the experience with the terminal server technology will be extremely dissatisfactory for the user concerned .
This, however, is by no means an error, but is legitimate system behavior subject to the prevailing probabilities. Often, as a result of the mixture of user behavior and applications run in large terminal server farm environments, extreme load disparity is found between individual terminal servers. A user who becomes accustomed to high system performance one day might have to suffer applications with unacceptable response times the next . That is why there must be the option of monitoring the user sessions and their processes to see how many resources they consume throughout the entire duration of the runtime. This is particularly true for the use of processors and main memory. (See Adjusting Server Dimensions in Chapter 5.)
A technical solution to the problem of controlling resources on terminal servers is offered by the Windows System Resource Manager, which is an optional function with Windows Server 2003, Enterprise Edition or later. The Windows System Resource Manager (WSRM) is not part of the default installation package on Windows Server 2003, however. WSRM is available on the second CD supplied with the Enterprise Server and the Datacenter Server. If the administrator does not have the Windows Server 2003 installation CDs, WSRM can be downloaded from http://www.microsoft.com/windowsserver2003/downloads/wsrm.mspx .
| Note | One alternative would be, of course, to enable a user session being run on one terminal server to be moved to another terminal server experiencing a lower load. This could be done automatically or at the request of a user. (The option could be called, Find me a better terminal server. ) However, to do this, the current system status and all applications launched in the user session would have to be frozen, transferred to the other terminal server, and re-enabled there. Also, the Terminal Services client would have to accept the change in the physical address of its communication partner while at the same time maintaining a consistent user interface. Such an approach can best be compared with that of a server cluster, albeit without all of the processes being launched on different servers in advance. Regrettably, such an approach has not even been attempted (yet)! But as you can see, there is considerable potential for terminal server technology to develop. |
Functions and Installation
With the Windows System Resource Manager, administrators can control the assignment of CPU and main memory resources to applications, services, and processes. Managing resources in this way increases the system performance and reduces the risk of applications, services, or processes having a damaging impact on the rest of the system. Moreover, users find the behavior of applications and services executed on the computer more uniform and predictable.
From a technical point of view, WSRM consists of the Wsrm.exe service and an MMC snap-in as the administration interface. The service ensures the implementation of all the rules determined through the administration interface. The Windows System Resource Manager also contains a calendar function that is useful for planning resource assignment policies. Furthermore, it provides a system of recording resources that can be used to collate performance data and other relevant data.
It is fairly easy to install the Windows System Resource Managers on a terminal server. The only option that might need to be looked at in more detail is the option of installing server components (the WSRM service) and the administration interface separately on different computers.
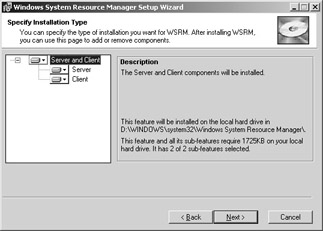
Figure 11-9: Installing the Windows System Resource Manager.
Using Windows System Resource Manager on Terminal Servers
The Windows System Resource Manager facilitates the resource management for several different applications and users on one terminal server. A dynamic management algorithm for process priorities is available that can help determine the assignment of system resources to numerous processes. Using this algorithm, administrators can draw up resource assignment policies incorporating several different resource assignments. The resource assignment itself includes process-matching criteria, a CPU consumption target, different memory allocation limits, or a processor assignment:
-
Process-matching criteria Mechanisms used to match running processes to a predefined policy assigning resource allocations .
-
CPU consumption targets Specifies a CPU target bandwidth for the assignment of resources. WSRM uses an algorithm for dynamic process priority allocation to limit, wherever possible, a process CPU usage. This limit is defined by the consumption target stated in the selecting resource policies for the process.
-
Memory allocation limits Two values limiting main memory may be entered. The working set memory corresponds to the amount of the physical main memory assigned to the process by the operating system. The committed memory resides in the working set of a process or maps to a disk file. This value has a tendency to become larger over time if the process is not able to release certain memory section, which is often referred to as a memory leak. The value relates to the memory limitation per process and not to the entire process-matching criterion.
-
Processor assignment On systems with more than one processor, a group of processors is entered here, on which the process will be executed exclusively. This is also known as processor affinity or CPU affinity .
Once a resource assignment is allocated to a process group, the Windows System Resource Manager service monitors the resource assignment of the individual processes. If the resource assignment of a process is exceeded, the service will attempt to reduce the resource utilization to the predefined target value.
The common procedure to define resource control rules for a terminal server requires the following steps:
-
Create a new process-matching criterion containing applications or user groups whose resources are to be controlled on the terminal server.
-
Create a new resource allocation policy, and add process-matching criteria to it. Here you can set the CPU consumption targets in percent, determine the memory allocation limits, and assign the available processors.
-
If there is more than one process-matching criterion in a resource assignment policy, you can modify their order and thereby their priority.
-
Set the desired resource allocation policy as a managing policy.
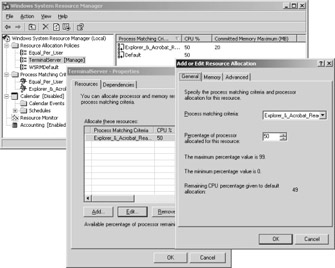
Figure 11-10: Configuring a resource allocation policy.
Within a resource allocation, a management rule can be set using the Advanced tab. This determines how CPU resources are allocated. You can select from the following three management rules:
-
Standard The allocation of the CPU assignment to the selected processes is not managed by the Windows System Resource Manager. With this setting, suballocation of processor resources can also be determined.
-
Equal per process The CPU assignment is the same for all processes selected.
-
Equal per user The CPU assignment is the same for all users. The processes created by a user can consume as much of the user s total CPU assignment as necessary.
Note By using the Wsrmc.exe command-line tool, Windows System Resource Manager can also be managed using the command prompt.
The WSRM provides some very interesting administration options for terminal servers. However, it is too new to be able to make any qualified statements on how it behaves in production environments. Furthermore, it does not really allow for intuitive configuration, and the results can be dramatic when the predetermined limits are reached. For example, application processes might be shut down without warning or might not start again. This is not a welcome result when managing resources in terminal server environments.
AppSense Resource Management Tools
AppSense Technologies Performance Manager and Optimizer products take a somewhat different technical approach to managing resources than does Microsoft s Windows System Resource Manager. But they still address the issue of optimizing the allocation of processor capacity and main memory to the different applications of a terminal server such that the number of unexpected system bottlenecks is kept to an absolute minimum.
| Note | Products from manufacturers like Real Enterprise Solutions ( http://www.respowerfuse.com ), Emergent OnLine ( http://www.go-eol.com ), and many others also cover some aspects of terminal server resource management, as described in this section with the AppSense resource management tools as an example. |
AppSense Performance Manager
Like the Windows System Resource Manager, the AppSense Performance Manager does not stop at simply logging the resources consumed. It, too, takes a proactive approach to resource distribution. It focuses in particular on applications that sometimes display damaging behavior on terminal servers as a result of particular constellations. Often, this behavior can be traced back to the fact that many applications were not developed for use on terminal servers. (See Applications in Multiple-User Mode and Developing Compatible Applications in Chapter 5.)
| Note | The Windows System Resource Manager guarantees a minimum of resources that will be made available to a process at any given time. Conversely, the AppSense Performance Manager defines a maximum of resources that represent the limit for a process. Predefined actions are taken once this limit is reached. The possibilities and the system impact of the two tools therefore differ in this respect, but they also complement each other in some cases. |
So how do the bottlenecks on terminal servers arise that can unexpectedly lead to a dramatic deterioration in response times and thus affect all user sessions on a server? In particular, very large data imports, data exports, or calculation tasks , using old 16-bit or DOS applications, and loading certain components or active Web pages in Web browsers often result in as much as 100 percent of processor capacity being consumed at a given time. A simple example for such a misbehaving process can even be a poorly programmed macro for Microsoft Excel. If a user executes this in a terminal server session, the sessions of other users will suddenly slow down dramatically. The user who caused the problem is not aware of being the culprit ”the user will believe that the system was used correctly.
Similar effects arise if the system s memory experiences excessively heavy use. Both processor and memory bottlenecks are two things that make users extremely unhappy . If these problems occur for no apparent reason and seem to follow no visible pattern of behavior, the system administrator is left searching for the cause. In many cases, the simplest solution is chosen , whereby more servers are attached to an existing farm without all of the available resources being used optimally.
The AppSense Performance Manager allows effective policies for controlling processor utilization and memory use to be easily set up. After the Performance Manager software components have been installed by a wizard on the central Deployment Server, the system administrator can use an administration console to configure the Performance Manager. (See Chapter 8 for a description of the AppSense Deployment Subsystem.)
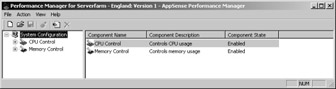
Figure 11-11: The main administration console window of AppSense Performance Manager.
The main window consists of two sections. On the left, the individual administration objects are listed and can be selected. On the right is the options window for the configuration. The system administrator has two administration objects available: CPU Control and Memory Control.
The CPU Control administration object offers two options. The first option is named Application Limits and allows the system administrator to define a CPU limit for one or more applications. Once the CPU limit has been set, all combined instances of this application cannot use more processor resources than allowed by the system administrator. In this way, the amount of resources consumed by problematic applications can be limited or applications that are not critical to company operations can be given a lower priority in terms of resource consumption.
The Intelligent Process Management option monitors the processor utilization of processes and threads on a continuous basis. If excessive load is identified, the Performance Manager steps in to actively reduce it. The permissible amount of processor utilization can be adjusted, and the number of controlled processes and threads modified. The corresponding control model is based on a few simple parameters that enable the applicable factors to be precisely adjusted (for example, the allowed incremental processor utilization). By modifying user or group-specific factors, a defined group of users who need to carry out particularly processor- intensive tasks can be assigned a higher proportion of processor resources. Furthermore, individual applications can be assigned a set percentage of processor resources, which enables purposeful control of applications that use up a disproportionately high share of processor resources.
The Memory Control administration object allows the memory used at the application and the user level to be limited. Limiting memory utilization is a two- step process. If the memory utilization exceeds the warning level, a warning message flashes up on the user s screen stating that too much memory is being used. If the memory utilization exceeds the blocking level, all requests to start up a new application or to use up more memory will be blocked. The user is told the reason why it is being blocked in a message box. The user concerned will only be able to use additional memory after freeing up some memory by closing other applications or files. The text in both of the message boxes described here can be modified by the administrator.
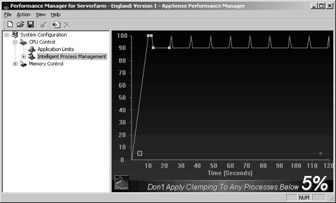
Figure 11-12: Configuring the Intelligent Process Management: the maximum processor load is limited to 90 percent. Regular checks are performed to see if the limitation is still necessary.
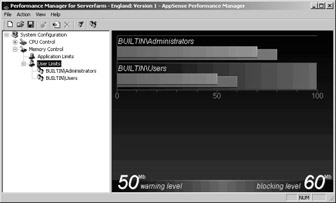
Figure 11-13: Limiting the memory for different user groups. The highlighted user group is on a warning level of 50 MB and a blocking level of 60 MB per user session.
Additionally, the Performance Manager enables you to monitor many events and performance indicators relating to processor and memory utilization. This allows detailed reports to be compiled on sessions, users, and applications. The data can then be analyzed using the available report templates.
AppSense Optimizer
Many applications are still not designed or developed with Terminal Services in mind, which can lead to performance and functionality problems when they are deployed in a multi-user environment. Even if an application functions correctly, it is rare that it has been optimized to make the most efficient use of a server s resources. These problems often go unnoticed in a desktop environment, where only a single user runs the application. However, in a multi-user environment, where many instances of the same application are running concurrently, these inefficiencies can have a severe effect on server scalability and the number of users supported.
There is little that can be done to solve many of the inefficiencies caused by applications, other than asking the software vendors to improve their applications, which is rarely an option. Fortunately, there is a particular inefficiency that can be solved without the intervention of the original software vendor. This is the excessive virtual memory that is often allocated during the loading of Dynamic Link Libraries (DLL), which can be avoided by performing suitable optimizations.
Many applications require one or more DLLs to be loaded to provide their functionality. These include common system DLLs, to provide access to the Window s kernel objects and GUI components, such as Kernel.dll and User32.dll. In addition, application and vendor specific DLLs are usually loaded, to provide common application functionality. ActiveX controls (OCX) and Control Panel utility applications (CPL) are specialized versions of DLLs.
When a DLL is loaded it is usually shared across all processes that require it, avoiding duplication in virtual memory. This sharing is particularly beneficial in a Terminal Services environment, where many instances of the same DLL will be loaded because it can be shared across sessions. Only the data sections in a DLL need to be private to each application instance, whereas the program code can be shared because it does not need to change from one instance to the next. Unfortunately, this sharing of code in memory can only occur if each DLL successfully loads into memory at its preferred load address. If a DLL fails to load at its preferred load address, because the memory address range is already in use, the operating system must move it to an alternative address in memory during loading.
In the 32-bit version of Windows Server 2003 each process has a 4 gigabyte (GB) virtual address range. Most of the lower 2 GB address range is available for code and user data and is private to each process. With the exception of a few system DLLs, each DLL is loaded into the lower 2 GB address range. If the preferred load address of a DLL would cause it to load into a set of memory pages that are not free, a load address collision occurs. The operating system must relocate the DLL to an alternative address, which requires address fixups to be performed on the code pages. The process of performing fixups not only results in a slower load time, but also causes an increase in pagefile usage.
AppSense Optimizer endeavors to eliminate the inefficient use of virtual memory by modifying the loading behavior of DLLs. This is done in the following three phases:
-
Analysis phase The analysis phase is usually scheduled to run periodically and may also be triggered manually from the management console. It analyzes the applications currently in use and identifies any applications that have had one or more DLLs relocated , due to load address collisions. It continually monitors the applications in use because many applications load DLLs on demand, dependent on the functionality being used by the users.
-
Optimization phase The optimization phase creates optimized versions of the DLLs identified by the analysis phase. This optimization process is similar to the process performed by the operating system during load address collision, but instead of saving the fixups to the pagefile, a separate version of the DLL is created on disk in an optimization cache. The original application DLLs are left intact during optimization. In addition, the optimization process takes into account that a DLL might be loaded by different applications, as opposed to different instances of the same application. The address fixups in the DLL are performed to be compatible with both situations.
-
Kernel-level optimization loader Once a DLL has been optimized, it needs to be loaded by the application. The optimization loader does this by intercepting the application s request to load its DLLs at kernel level, and then automatically loading an optimized version from the optimization file cache. This process is completely seamless to the application and results in the application avoiding load address collisions and the expensive relocations that would otherwise occur.
Note Depending on the constellation of the applications deployed and the quality of their corresponding DLLs, the results of this optimization might be very different. It is therefore advisable to conduct extensive tests in a production environment prior to using the AppSense Optimizer.
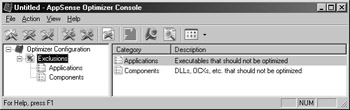
Figure 11-14: The AppSense Optimizer console window.
The AppSense Optimizer is integrated into the same architecture as the other AppSense products. In the corresponding administration console, particular applications and components can be excluded from the optimization, although this should not be necessary in most cases. What is more important in terms of settings is that the analysis and optimization phases be planned as one-time or regular events. One of the really interesting functions of the AppSense Optimizer is the possibility to disable the loading of the optimized DLLs as required and to re-enable it at a later date. Consequently, it is easy to compare the two settings. During system repair work, it might also be necessary to stop the optimization, which this function allows.
Citrix Resource Management
Citrix Resource Management is a component of the Citrix MetaFrame XP Presentation Server, Enterprise Edition. It is directly integrated in the Management Console for MetaFrame XP. The MetaFrame XP Presentation Server Resource Manager basically enables several MetaFrame servers in a network to be monitored . It has performance indicators and metrics that allow server performance, application utilization, and user activities to be recorded and displayed. It is possible to display all relevant data graphically in 15-second intervals. Furthermore, each MetaFrame server saves all data it recorded in the past 96 hours. For longer- term data storage, data can be archived on an external database server, which is named a summary database. All of the data collated can, of course, be used to compile meaningful reports on the resource utilization of a MetaFrame server farm. Unlike the Windows System Resource Manager and the AppSense Performance Manager, the Citrix Resource Management only allows the relevant performance object metrics to be observed ; it does not facilitate predefined and proactive intervention in system behavior.
The Resource Management tool is present at various points in the object hierarchy in the Management Console for MetaFrame XP:
-
Resource Manager A separate object that enables the analysis of the recorded performance indicators and the basic configuration for the reaction when predefined limits are met. This can be through various tabs. The object also sends a report to administrators or an administration instance by SMS, SNMP, or e-mail message.
-
Applications For each published application, metrics for the Resource Manager can be added or removed using the context menu of the object hierarchy. The only available metric for applications is Count , which contains the number of users that have opened the relevant published application. The status of a metric can be viewed for each application using the Resource Manager tab.
-
Server For each server in a farm, metrics for the Resource Manager can be added or removed using the Resource Manager tab s context menu. Here, too, the status of a metric can be viewed for each server.
Note All configuration data in the Citrix Resource Management is stored centrally in the IMA database.
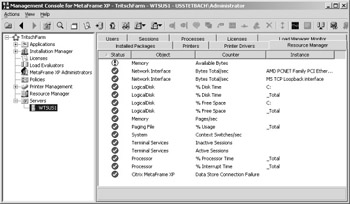
Figure 11-15: Predefined server counter objects representing metrics in the Citrix Resource Manager.
Threshold values that determine the status can be set for each metric and predefined actions can be performed once a certain status is achieved for a configured time interval. The status of the metrics is expressed as colors and can be any of the following:
-
Green The metric is within the boundaries of a functioning environment.
-
Yellow The metric has passed the first threshold for a predefined minimum time and, its status can therefore be considered as a warning. A warning message can be generated, if required.
-
Red The metric has passed the second threshold for a predefined minimum time, and its status can therefore be considered as critical. An alert message can be generated, if required.
-
Blue A new metric has been added but not yet configured. Only when the properties have been configured will it change to a different color .
-
Gray The metric has been stopped manually for a limited period and is therefore unable to send out a warning message. However, metric data continues to be collected and stored.
-
Black The metric has been stopped manually for an unlimited period and is therefore unable to send out a warning message. However, metric data continues to be collected and stored.
Configuring a metric involves determining the yellow and the red thresholds and the corresponding minimum time until the displayed status changes. It is also possible to configure warning and alert messages that notify you by SMS, SNMP, or e-mail message when a status change occurs. Only for the change to red status is it possible to configure a script that can be executed to launch countermeasures.
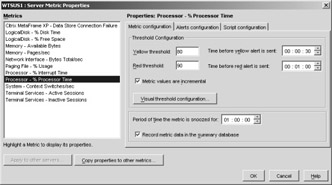
Figure 11-16: Dialog for configuring the server metric properties.
The status of each individual metric can only be viewed within the respective object structure. This concerns either published applications or server farms. However, you can obtain an overview of all metrics with yellow or red status using the Watcher tab in the Resource Manager object of the Management Console for MetaFrame XP. Alternatively, the Resource Manager ”Show Resource Manager Watcher Window icon in the toolbar of the Management Console for MetaFrame XP allows you to open a separate window that displays the same status information on a permanent basis.
Unlike some of the resource management tools described above, the Citrix Resource Manager does not enable the configuration of preventive measures for resource bottlenecks, with the exception of a script when the status of a metric changes to red. Instead, the Citrix Resource Manager s purpose is to monitor the utilization of resources, to archive, and to inform administrators when thresholds are overstepped. Neither the correct configuration of thresholds nor the launching of appropriate countermeasures to deal with resource bottlenecks are automated and both depend to a large degree on the experience of the administrators. This tool is therefore not suitable for large-scale environments in which different groups of people with different knowledge bases are responsible for setting up and operating the MetaFrame servers. For small environments or highly skilled administrators, though, it does represent a powerful tool.
One special feature of Citrix Resource Management is the option to generate billing information including fee profiles and cost centers from the metrics data. This can be used to map the costs of a MetaFrame environment onto users, groups, and cost centers through charging profiles according to the principle of causality .
Managing Logical Resources
Using the Windows Server 2003 Group Policies, it is possible, without the use of any other tools, to assign a range of logical resources in a way that can be properly used in a large-scale terminal server environment. One of these logical resources is the time zone. In geographically dispersed environments, it might be necessary to avoid using the server time zone and to redirect the client s time zone onto the user session. This is particularly important in cases when not only are applications accessing the terminal server, but local client applications are also accessing a common file server. If the time zone is not redirected, a file s creation and modification dates might become inconsistent if they are changed by different applications on the terminal server and on the client.
The time zone redirection function in Windows Server 2003 is enabled through the settings under Computer Configuration\Administrative Templates\Windows Components\Terminal Services\Client\server Data Redirection\Allow Time Zone Redirection in the Group Policy Object Editor. When the function is enabled, the clients with permission to perform a time zone redirection send the respective information to the server. The server s Greenwich Mean Time (GMT) is used to calculate the current session time. At present, the Remote Desktop Connection distributed with Windows XP and Windows Server 2003 and the RDP client in version 5.1 of Windows CE are the only clients capable of redirecting a time zone.
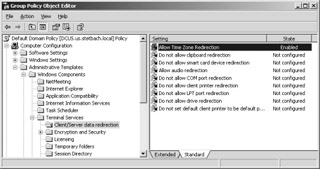
Figure 11-17: Setting a time zone redirection.
| Note | If the settings for the time zone redirection are modified by an administrator, only new user sessions will display the corresponding behavior. |
Another important setting for logical resources is located under Computer Configuration\Administrative Templates\Windows Components\Terminal Services\Licensing\License Server Security Group in the Group Policy Object Editor. This setting controls which servers are issued licenses. The default setting is that every computer that requests a license is issued with one. However, this can lead to undesirable side effects in large environments. For example, licenses might be issued to computers that are not part of the intended target group.
Enabling the setting for logical resources will automatically generate a local group named Terminal server computers . If the target computer of these settings is a domain controller, this group is located locally on the domain. If the administrator sets up a global group with the accounts of all terminal servers and license servers that belong together, the administrator can assign these to the local (or domain- local) group named Terminal server computers . As a result, licenses are issued within this group only. If the terminal servers continue to allow access by certain user and computer groups only, the logical resource Licenses is assigned in a highly dedicated manner. Consequently, differently assigned license servers can be operated across several domains within a corporate network.
| Note | Three tools that can be used to analyze the license setting of a terminal server environment: the Terminal Server Licensing (Lsreport.exe) tool displays a list of license tokens assigned by a license server, the Terminal Server Client License Test (Tsctst.exe) queries details about license tokens on a given client, and the License Server Viewer (Lsviewer.exe) tool performs a license server discovery process. You can access these on the Microsoft Web site at http://www.microsoft.com/windowsserver2003/techinfo/reskit/resourcekit.mspx . |
EAN: 2147483647
Pages: 119