File InputOutput
File Input/OutputFile input and output (I/O) operations retrieve information from and store information in a disk file. LabVIEW has a number of very versatile file I/O functions, as well as some simple functions that take care of almost all aspects of file I/O in one shot. We'll talk about the simple file functions in this chapter. All are located in the Programming>>File I/O subpalette of the Functions palette. How They WorkThe File functions expect a file path input, which looks kind of like a string. A path is a specific data type that provides a platform-specific way to enter a path to a file. We talked about them briefly in Chapter 4, and they'll come up again in Chapter 14, "Advanced LabVIEW Data Concepts." If you don't wire a file path, the File functions will pop up a dialog box asking you to select or enter a filename. When called, the File functions open or create a file, read or write the data, and then close the file. The files created with the VIs we'll talk about now are just ordinary text files. Once you have written data to a file, you can open the file using any word processing program to see your data. One very common application for saving data to file is to format the text file so that you can open it in a spreadsheet program. In most spreadsheets, tabs separate columns and EOL (end of line) characters separate rows. Express Writing and Reading of Measurement Files
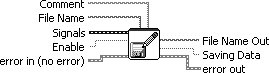
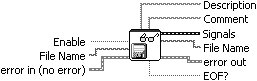
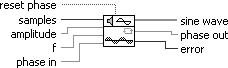
For quick and interactive configuration of data file I/O operations in LabVIEW, consider using the Write To Measurement File and Read From Measurement File Express VIs, shown in Figure 9.29 and Figure 9.30. Figure 9.29. Write To Measurement File Figure 9.30. Read From Measurement File These VI pass data as the dynamic data type (which we learned about in Chapter 8, "LabVIEW's Exciting Visual Displays: Charts and Graphs"), so they can handle just about any type of file containing measurement data. To configure these Express VIs after they are placed on the block diagram, open the configuration dialog by double-clicking on the subVI or selecting Properties from the pop-up menu. From the Write To Measurement File Express VI configuration dialog (shown in Figure 9.31), you can specify how a file will be formatted, and what data to store in the file. Figure 9.31. Write To Measurement File configuration dialog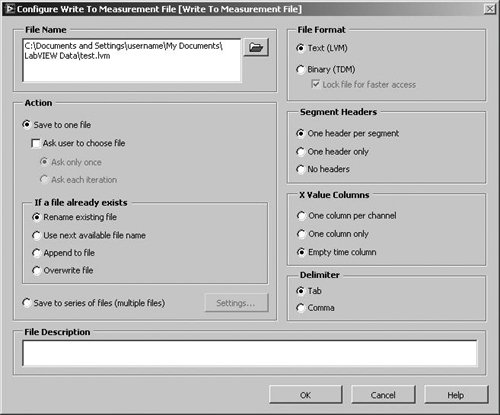 From the Read From Measurement File Express VI configuration dialog (shown in Figure 9.32), you can specify the format of the file to be read. If you press the Read File Now button, LabVIEW will read the file once and populate the Sample Data table to show you whether the read operation worked successfully. Figure 9.32. Read From Measurement File configuration dialog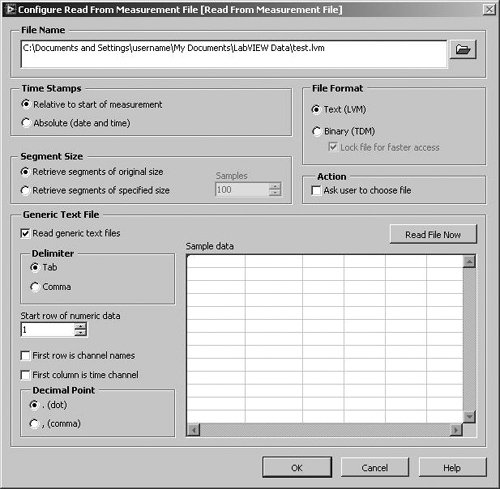 Writing and Reading Spreadsheet Files
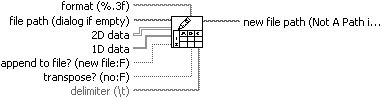
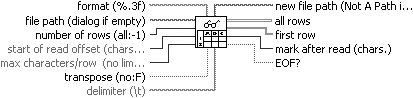
If the Express VIs do not provide you with enough flexibility, you can read and write directly to spreadsheet text files with Write To Spreadsheet File and Read From Spreadsheet File. Write To Spreadsheet File converts a 2D or 1D array of single-precision numbers to a text string, and then writes the string to a new byte stream file or appends the string to an existing file. You can optionally transpose the data. Do not wire inputs for both 1D and 2D data (or one will be ignored). The text files created by this VI are readable by most spreadsheet applications. Figure 9.33. Write To Spreadsheet File.vi Read From Spreadsheet File reads a specified number of lines or rows from a numeric text file, beginning at a specified character offset, and converts the data to a 2D single-precision array of numbers (see Figure 9.34). You can optionally transpose the array. This VI will read spreadsheet files saved in text format. Figure 9.34. Read From Spreadsheet File.vi.
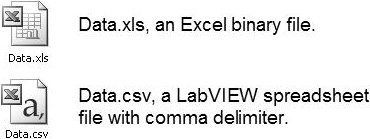
Write To Spreadsheet File.vi and Read From Spreadsheet File.vi do not have Error In or Error Out terminals. They do all of their error handling internally, and will open an error dialog if an error does occur inside the VI. This behavior can be nice for simple applications, but is generally undesirable for advanced applications. Spreadsheet Files: CSV Versus XLSWhat's the Difference?Write To Spreadsheet File.vi and Read From Spreadsheet File.vi write and read data as text files using a delimiter (usually a comma or tab) to separate columns and an end of line character (\r, \n, or \r\n) to separate rows. Commonly, a spreadsheet file that uses commas as the delimiter is referred to as a Comma Separated Values (CSV) file and is routinely saved with the filename extension ".csv," which Microsoft Excel, OpenOffice.org Calc, and other spreadsheet applications will recognize. For example, on a computer with Microsoft Excel installed, you can double-click on a CSV file and it will open in Excel. In fact, CSV files (if named with a ".csv" file extension) will have an icon, very similar to Excel (".xls") files, as shown in Figure 9.35. Figure 9.35. Excel icons for XLS and CSV files However, it is important to realize that if you save a file in Excel (or another spreadsheet program), it will not save the file as a CSV (unless you specify that option); but rather, it will be saved as a binary file (usually with a different file extension, such as ".xls" for Excel files). The resulting binary file cannot be read using Read From Spreadsheet File.vi. The bottom line is that users of your application may say that they want data stored in Excel files, but what they really mean is that they want data stored in a file that Excel can read. Generate CSV files for your users, and they will probably be very happy with the resultand sometimes they won't even know the difference. Activity 9-3: Writing to a Spreadsheet FileYou will modify an existing VI to save data to a new file in ASCII format. Later you can access this file from a spreadsheet application.
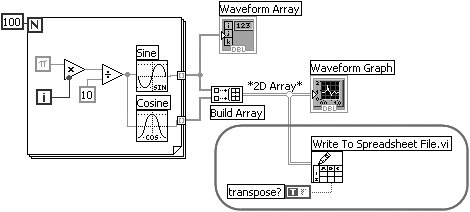
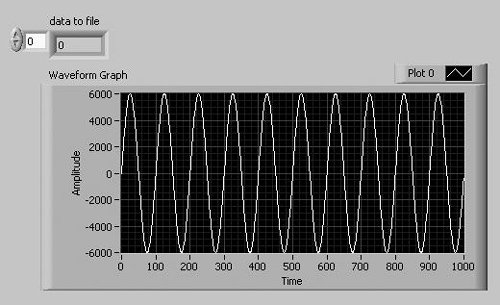
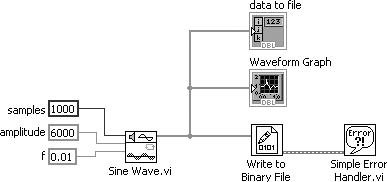
Figure 9.36. Graph Sine Array.vi block diagram, with modifications you will perform during this activity
Write to Spreadsheet File VI The Write To Spreadsheet File VI (Programming>>File I/O palette) converts the 2D array to a spreadsheet string and writes it to a file. If no path name is specified (as in this activity), then a file dialog box will pop up and prompt you for a file name.
Boolean Constant The Boolean Constant (Programming>>Boolean palette) controls whether or not the 2D array is transposed before it is written to file. To change it to TRUE, click on the constant with the Operating tool. In this case, you do want the data transposed because the data arrays are row specific (each row of the 2D array is a data array). Because you want each column of the spreadsheet file to contain data for one waveform, the 2D array must first be transposed.
Activity 9-4: Reading from the Spreadsheet FileYou will write a VI to read in the data from the file written in the last exercise and plot it on a graph.
More Writing and Reading of FilesYou've seen how to read and write spreadsheet files or measurement data (using the dynamic data type). These functions are very easy to use. Now we will discuss basic file I/O functions for working with text and binary files. Writing and Reading Text Files
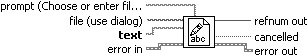
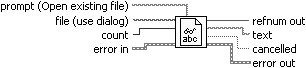
If you need to read or write a plain text file, you can use the LabVIEW functions on the Programming>>File I/O palette Write To Text File and Read From Text File. Use the Write To Text File (shown in Figure 9.38) to write a string of characters to a file. Use Read From Text File (shown in Figure 9.39) to read a string of characters from a file. Figure 9.38. Write To Text File Figure 9.39. Read From Text File
The file input of Write To Text File and Read From Text File are path data types. However, you can wire a file refnum (which is discussed in Chapter 14, "Advanced LabVIEW Data Concepts") instead and the file input will adapt to a refnum type. These VIs are smart, in the sense that they can accept either a path or a refnum as their input. It is important to note, that when you wire a path input into these VIs, if you do not connect a wire to the refnum out terminal, then you do not need to close the file refnum using the Close File function (which is discussed in Chapter 14). Write To Text File and Read From Text File are smart and will automatically close the file, if you do not wire anything to the refnum out terminal. The same is true for Write To Binary File and Read From Binary File When you call Write To Text File and Read From Text File repeatedly (in a While Loop, for example), they will "remember" where they left off. For the Write To Text File function, this means that each time you write a string of characters, they are appended to the last string of characters that you wrote. For the Read From Text File function, this means that when you read some number of characters (specified by the count input), it will read that number of characters starting where you left off, last time you read the file. LabVIEW keeps track of where you left off automatically, storing this position in the file marker, to make your life easier. As we will learn next, we can explicitly set and get the position of the file marker, which makes it possible to have random access to data stored in large files. Writing and Reading Binary Files
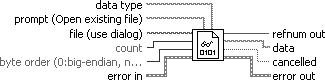
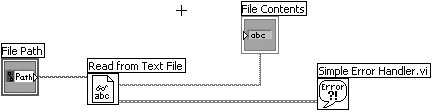
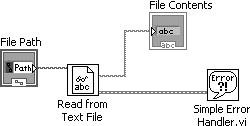
Just as you can read and write plain text files, LabVIEW also gives you functions to read and write binary files. Binary files are efficient for storing large amounts of non-text data because, generally, they take up much less disk space than text files. For example, storing the number "3.14159265358979" in a binary file might only take up eight bytes (as a double-precision number), whereas in a text file it would take up 16 bytes (one byte for each character). On the other hand, you can't easily open binary files with another application (like Word or Excel) because those other applications don't "know" how the data was formatted. Because a binary file could contain any type of data (for example, an array of integers, or a cluster of strings), it's up to you to specify how to read back that data. When you write a binary file with LabVIEW, you'll generally use LabVIEW to read back that binary file. The Write To Binary File function is very easy to use and works just like the Write To Text File function we saw earlier, except that you can wire any kind of data you like to the data input (see Figure 9.40). The file input can be either a path or a file refnum. Figure 9.40. Write To Binary File The Read From Binary File is also easy to use, and is similar to the Read From Text File function, except that you must tell Read From Binary File what kind of binary data is stored in the file you are trying to read (see Figure 9.41). You do this by wiring the right kind of data to the data type input. You must wire the same data type that you used to write the file. Otherwise, you'll get garbage results in the data output. Figure 9.41. Read From Binary File For example, if you wrote arrays of Booleans to your binary data file, then you need to wire an array of Booleans to the data type input. Activity 9-5: Reading a Text FileYou will create a VI that reads the entire contents of a text file and displays the contents in a string indicator and the file size in a numeric indicator.
Read from Text File Function Read From Text File function (Programming>>File I/O palette) returns the contents of a text file in a string.
Simple Error Handler.vi Simple Error Handler.vi (Programming>>Dialog & User Interface palette) displays a dialog if there is an error in one of the File I/O functions.
Activity 9-6: Writing and Reading Binary FilesAs you saw in the previous activity, reading a text file is pretty trivial. In this activity, you'll build a VI that writes to a binary file and then another VI that can read those binary files.
|


EAN: 2147483647
Pages: 294
- ERP Systems Impact on Organizations
- The Second Wave ERP Market: An Australian Viewpoint
- Enterprise Application Integration: New Solutions for a Solved Problem or a Challenging Research Field?
- Intrinsic and Contextual Data Quality: The Effect of Media and Personal Involvement
- Development of Interactive Web Sites to Enhance Police/Community Relations