Performance Monitor
| |
Windos 2003's performance monitor utility (which is now called System Monitor) is an under-appreciated work of inspired genius. We say that not only because it' true, but also because we've come to rely on this outstanding tool to help us with all types of troubleshooting over the past few years .
When you first launch System Monitor (Start Administrative Tools Performance), it presents readings from three default counters, as Figure 19-5 indicates. With a little work and planning. System Monitor can offer a broad range of useful information about the performance of your computer system and netweork.
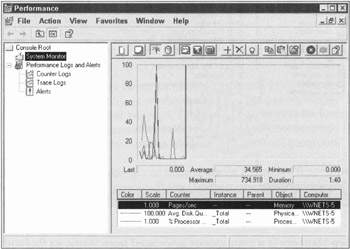
Figure 19-5: The Performance Monitor.
You use the primary display of System Monitor to monitor either real-time or recorded measurements. Depending on which toolbar button you click, the display area can show measurements in graph form (such as an EKG), in histogram form (like a thermometer), or in report form (like a budget). See Chapter 20 for additional information on System Monitor.
Counting yer objects
Performance is measured on a counter and object basis. Chapter 16 goes into some detail about Windows 2003 objects. For this chapter, all you need to know is that everything in the Windows 2003 environment is an object, and each object has its own specific counters that measure certain aspects of the performance or activities of that object. The full context of performance is based on the following:
-
Computer: The source system of the object
-
Object: The subsystem of interest
-
Counter: The aspect of performance of interest
-
Instance: The specific object to be measured when multiple objects of the same type exist on a single system
Counters are added to the display area by clicking the big plus sign button on the System Monitor toolbar. This reveals the Add Counters dialog box, where you can select the context of the counters you want displayed. If you click the Explain button in this dialog box, details about the selected counter are revealed.
Here are some of the most important object and counter pairs to watch (in the following list, the object name appears to the left, followed by a backward slash, followed by the counter name ):
-
Server\Bytes Total/sec: Shows how much data your server is handling over time (for a basic measurement of how busy your system is). Other counters for the server object, such as Sessions Errored Out, Work Item Shortages, Errors System, and Blocking Requests Rejected, can all indicate potential system bottlenecks.
-
Memory\Pages/sec: Shows how frequently the server is moving data from memory to disk, and vice versa. If this number gets large (mre than 2500 pages per second on an average server), it can indicate a shortage of RAM on your server.
-
PhysicalDisk\Avg. Disk Queue Length: Indicates how many disk requests are pendidng service. I fhis number stays over 2.0 for long, it can indicate a disk drive that's too slow to handle its load or one that's overwhelmed by current disk activity. Sometimes, this indicates a need for a faster drive or disk controller, or even a faster disk subsystem.
| Warning | The objects used to monitor disk activity can cause performance problems even when System Monitor is not recording them. Therefore, by default, Windows 2003 enables only the PhysicalDisk counters and not the Logical Disk counters. Using the DISKPERF command-line tool, you can enable or disable both disk objects. For complete usage information, issue the diskperf /> command from a command prompt. |
| |
There are lots of books about performance monitoring and tuning for Windows NT 4.0 and Windows 2000, and we're sure that soon there will be many for Windows 2003 as well. Most of the tips for Windows NT 4.0 and Windows 2000 should apply to Windows 2003, but your mileage may vary.
Here are a few books we usually recommend for Windows NT 4.0 and Windows 2000 performance monitoring:
-
Windows 2000 Performance Guide by Mark Friedman (published by O'Reilly & Associates)
-
Windows 2000: Performance Tuning & Optimization by Kenton Gardinier (published by Osborne/McGraw-Hill)
-
Windows NT Server 4.0 Secrets by Valda Hilley (published by Wiley Publishing, Inc.)
Keep an eye on these authors for Windows 2003 versions of similar titles.
Search for Windows 2003 performance at http://www.amazon.com and you may come across some books that weren't out when this book was written. Good luck and happy hunting.
| |
Of logs and alerts
A major benefit of System Monitor is obtained through its logging capabilities. Through logs, you're able to capture performance data that you can review later. This not only allows you to collect data over extended periods of time without having to sit and watch, but also creates a historical paper trail for baselining, troubleshooting, and capacity planning.
Log files are created using the Counter Logs and Trace Logs selections of the Performance utility's main window. Counter Logs are used to record the measurements of specific counters (not just entire objects). Trace Logs are used to record memory and resource events.
Log files are created by highlighting either Counter Logs or Trace Logs in the left pane, right-clicking in the right pane, and then choosing New Log Settings. You need to name the log file and define the items it will record. For example, you may name the file server 1-2-2-02-cpu.log and record measurements from the CPU object. After you record a log file, you can view its content in the System Monitor display by clicking the View Log Data button (it looks like a cylinder) on the toolbar.
Another benefit (perhaps not so major) stems from the capability to define alerts. Alerts allow administrators to instruct System Monitor to watch certain counters and send a message when preset values are reached. Administrators use Alert view to issue warnings when disk space is running low or when network or CPU utilization becomes dangerously high. Think of Alert view as a type of system alarm capability. Generated whenever a counter's measurement crosses its defined threshold, an Alert event can do the following:
-
Record an item in the Application log of Event Viewer
-
Send a network message
-
Execute a batch file
-
Start logging performance data
You can define alerts in the Alerts area of the Performance utility's main window. Just select the Alert component in the left pane, right-click in the right pane, and choose New Alert Settings.
| |
EAN: 2147483647
Pages: 195