[Page 454 (continued)] Table 8.5 gives the leading seven soft drinks in 2003 and their percentage share of the market. Write a program whose form contains two buttons and a list box. When the first button is clicked, these data should be placed into a sequential file. When the second button is clicked, the sequential file should be used to display the seven brands and their sales in millions of gallons. (The entire soft drink industry sold about 15.3 billion gallons in 2003.) calculate the total percentage market share of the leading seven soft drinks.
Table 8.5. Leading soft drinks and percentages of 2003 market share.Coke Classic | 18.6 | Pepsi-Cola | 12.5 | Diet Coke | 9.4 | Mountain Dew | 6.4 | Sprite | 5.9 | Dr. Pepper | 5.6 | Diet Pepsi | 5.5 |
Source: Beverage World.
Suppose that the sequential file ALE.TXT contains the information shown in Table 8.6. Write a program to use the file to produce Table 8.7 in which the baseball teams are in descending order by the percentage of games won. Write a rudimentary word-processing program. The program should do the following: Use InputBox to request the name of the sequential file to hold the document being created. Set the label for a text box to "Enter Line 1," and allow the user to enter the first line of the document into the text box.
[Page 455]Table 8.6. American League East games won and lost in 2004.Team | Won | Lost |
|---|
Baltimore | 78 | 84 | Boston | 98 | 64 | New York | 101 | 61 | Tampa Bay | 70 | 91 | Toronto | 67 | 94 |
Table 8.7. Final 2004 American League East standings.| | W | L | Pct |
|---|
New York | 101 | 61 | 0.623 | Boston | 98 | 64 | 0.605 | Baltimore | 78 | 84 | 0.481 | Tampa Bay | 70 | 91 | 0.435 | Toronto | 67 | 94 | 0.416 |
When the "Record Line" button is clicked, determine if the line is acceptable. Blank lines are acceptable input, but lines exceeding 60 characters in length should not be accepted. Advise the user of the problem with a message box, and then set the focus back to the text box so that the user can edit the line to an acceptable length. When an acceptable line is entered, write this line to the file and display it in a list box. Change the label to "Enter Line 2," clear the text box, allow the user to enter the second line of the document into the text box, and carry out (c) for this line using the same list box. Continue as in (d) with appropriate labels for subsequent lines until the user clicks on a Finished button. Clear the list box, and display the number of lines written and the name of the text file created.
Write a program that counts the number of times a word occurs in the sequential file created in Programming Project 3. The filename and word should be read from text boxes. The search should not be sensitive to the case of the letters. For instance, opening a file that contained the first three sentences of the directions to this problem and searching for "the" would produce the output: "the" occurs six times. Create and Maintain Telephone Directories. Write a program to create and maintain telephone directories. Each directory will be a separate sequential file. The following buttons should be available: Select a directory to access. A list of directories that have been created should be stored in a separate sequential file. When a request is made to open a directory, the list of available directories should be displayed as part of an InputBox prompt requesting the name of the directory to be accessed. If the user responds with a directory name not listed, the desire to create a new directory should be confirmed and then the new directory created and added to the list of existing directories.
[Page 456]Add name and phone number (as given in the text boxes) to the end of the current directory. Delete name (as given in the text box) from the current directory. Sort the current directory into name order. Display the names and phone numbers contained in the current directory. Terminate the program.
Table 8.8 contains the statistics for a stock portfolio. (The current prices are given for February 1, 2005.) Table 8.8. Stock portfolio.Stock | Number of Shares | Date Purchased | Purchase Price/Share | Current Price/Share |
|---|
Amgen | 200 | 8/19/97 | 12.625 | 61.30 | Delta Airlines | 100 | 12/3/97 | 55.875 | 5.03 | Novell | 500 | 8/27/97 | 10.375 | 5.57 | PPG | 100 | 12/18/97 | 28.375 | 67.87 | Timken | 300 | 3/13/98 | 34.625 | 25.21 |
Compose a program to create the sequential file csvSTOCKS.TXT containing the information in Table 8.8. Compose a program to perform the following tasks. A possible form design is shown in Figure 8.10. Figure 8.10. Possible form design for Programming Project 6. 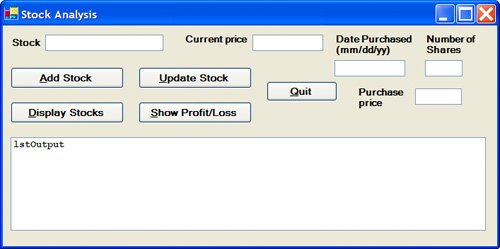
[Page 457]Display the information in the file csvSTOCKS.TXT as in Table 8.8 when the user clicks on a Display Stocks button. Add an additional stock onto the end of the file csvSTOCKS.TXT when the user clicks on an Add Stock button. The data for the new stock should be read from appropriately labeled text boxes. Update the Current Price/Share of a stock in the file csvSTOCKS.TXT when the user clicks on an Update Stock button. The name of the stock to be updated and the new price should be read from the appropriate text boxes. The file csvSTOCKS.TXT should then be copied to a temp file until the specified stock is found. The update record for this stock should then be written to the temp file, followed by all remaining records in csvSTOCKS.TXT. Finally, the original csvSTOCKS.TXT file should be erased and the temp file renamed to csvSTOCKS.TXT. Process the data in the file csvSTOCKS.TXT, and produce the display shown in Figure 8.11 when a "Show Profit/Loss" button is clicked. Quit. Figure 8.11. Output of Programming Project 6. 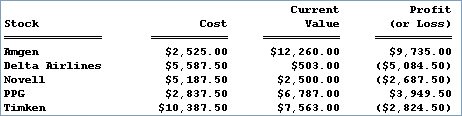
A department store has a CSV file containing all sales transacted for a year. Each record contains a customer's name, zip code, and amount of the sale. The file is ordered first by zip code and then by name. Write a program to display the total sales for each customer, the total sales for each zip code, and the total sales for the store. For instance, if the first six records of the file are Adams, John, 10023, 34.50 Adams, John, 10023, 60.00 Jones, Bob, 10023, 62.45 Green, Mary, 12345, 54.00 Howard, Sue, 12345, 79.25 Smith, George, 20001, 25.10 then the output in the list box will begin as shown in Figure 8.12 (on the next page). Figure 8.12. Sample output for Programming Project 7. (This item is displayed on page 458 in the print version) 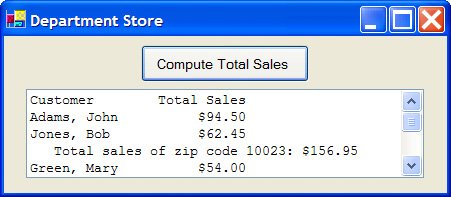 Savings Account. The sequential file csvACCOUNTS.TXT contains the name, account number, and beginning-of-month balance for each depositor. The sequential file csvTRANS.TXT contains all the transactions (deposits and withdrawals) for the month. Use csvTRANS.TXT to update the file csvACCOUNTS.TXT. Both files are sorted by account number. For each customer, display a statement similar to the one received from banks that shows all transactions and the end-of-month balance. Also, record all overdrawn accounts in a file. (As an optional embellishment, deduct a penalty if the balance fell below a certain level any time during the month. The penalty could include a fixed fee of $10, plus a charge of $1 for each check and deposit.)
[Page 458]A fuel economy study was carried out for five models of cars. Each car was driven for 100 miles of city driving, and then the model of the car and the number of gallons used were placed in a line of the sequential file csvMILEAGE.TXT. Table 8.9 shows the first entries of the file. Write a program to display the models and their average miles per gallon in decreasing order with respect to mileage. The program should utilize an array of structures with upper-bound 4, where each structure has three members. The first member should record the name of each model of car. This member is initially empty; each car model name is added when first encountered in reading the file. The second member should record the number of test vehicles for each model. The third member should record the total number of gallons used by that model. Note: The first members of the elements of the array should be searched each time a record is read to determine the appropriate index to use with the other two members. Table 8.9. Gallons of gasoline used in 100 miles of city driving.Model | Gal | Model | Gal | Model | Gal |
|---|
LeBaron | 4.9 | Cutlass | 4.5 | Cutlass | 4.6 | Escort | 4.1 | Escort | 3.8 | LeBaron | 5.1 | Beretta | 4.3 | Escort | 3.9 | Escort | 3.8 | Skylark | 4.5 | Skylark | 4.6 | Cutlass | 4.4 |
Each item in a supermarket is identified by its Universal Product Code (UPC), which consists of a sequence of 12 digits appearing below a rectangle of bars. See Figure 8.13. The bars have these digits encoded in them so that the UPC can be read by an optical scanner. Let's refer to the UPC as d1 -d2 d3 d4 d5 d6 -d7 d8 d9 d10 d11 -d12. The single digit on the left, identifies the type of product (for instance, 0 for general groceries, 2 for meat and produce, 3 for drug and health products, and 5 for coupons). The first set of five digits, d2 d3 d4 d5 d6, identifies the manufacturer, and the second set of five digits, d7 d8 d9 d10 d11, identifies the product. The twelfth digit on the right, d12, is a check digit. It is chosen so that
[Page 459]3 · d1 + d2 + 3 · d3 + d4 + 3 · d5 + d6 + 3 · d7 + d8 + 3 · d9 + d10 + 3 · d11 + d12. | (*) |
is a multiple of 10. For instance, for the UPC in Figure 8.11, 3 · 0 + 7 + 3 · 0 + 7 + 3 · 3 + 4 + 3 · 0 + 0 + 3 · 9 + 0 · 0 + 3 · 3 + 4 = 40.
Figure 8.13. A Universal Product Code. 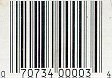
Since 40 = 4 · 10, 40 is a multiple of 10. In the event that the cashier has to enter the UPC manually and mistypes a digit, the above sum will usually not add up to a multiple of 10. Write a program to simulate an automated check-out counter at a supermarket. A master sequential file, called UPC.TXT, should have a record for each item consisting of fields for the UPC, name of the item, and the price of the item. For instance, the file might contain the following record: 070734000034 Celestial Seasons Sleepytime Tea 2.59
The file should be ordered with respect to the UPCs. The program should allow the cashier to enter UPCs one at a time, should keep a running total of the number of items processed, and should place the UPCs in an array. Each UPC should be checked with the sum (*) as soon as it is entered and should be reentered if the sum is not a multiple of 10. After all items have been processed, the program should sort the array of UPCs and then produce a receipt similar to the one in Figure 8.14 after making just one pass through the master sequential file. Figure 8.14. Sample output of Programming Project 10. 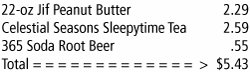
|