Viewing Behavior Reports
| < Day Day Up > |
| After the analysis portion of the task list has been completed, you may now view the associated report on the CSA MC. The report is available by choosing Analysis > Application Behavior Reports > Windows Behavior Reports. The information listed next to the report name is the description of the analysis that was entered during configuration, the name of the host that was analyzed, and the operating system of the host. Figure 11-9 shows a sample report list. Figure 11-9. Sample Behavior Analysis Report List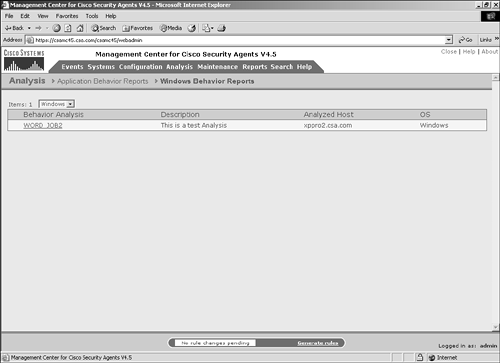 To view the report, click the name of the report. Doing so opens the report in the main browser window. The report has five sections:
To view the various sections of the report, click the title of the section in the left navigation pane. File EventsThe File Events section is divided into three sections:
To open the corresponding section and view detailed information, click that link in the navigation pane. You might notice that the number of directories accessed by the application is far higher than you expected. Much of this is related to the file-saving process in Microsoft Word, which uses file browsing to locate the appropriate folder. Directory SummaryThe Directory Summary portion of the File Events section provides the following information, as shown in Figure 11-10:
Figure 11-10. Directory Summary Section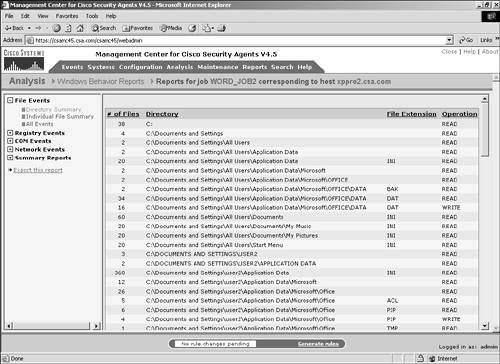 NOTE If network file shares were used by the application during the analysis, they will be at the top of the directory listing because they begin with the backward slash special characters (\\), as in \\fileserver\share\directory\filename.txt. Individual File SummaryThe Individual File Summary portion of the File Events section provides the following information, as shown in Figure 11-11:
Figure 11-11. Individual File Summary Section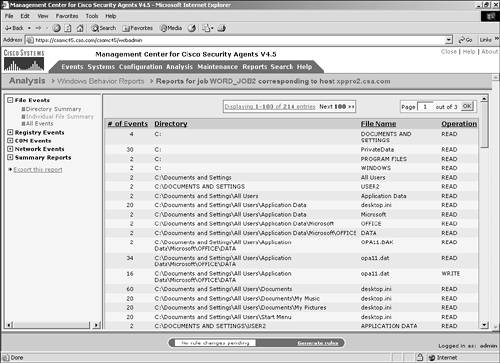 This view is limited to 100 entries per page with the option to view the next or a specific page of data. NOTE The filenames listed in this report also list directories, which display in all capital letters to show what READ and WRITE operations occurred to those directories. All EventsThe All Events portion of the File Events section provides the following information, as shown in Figure 11-12:
Figure 11-12. All Events File Section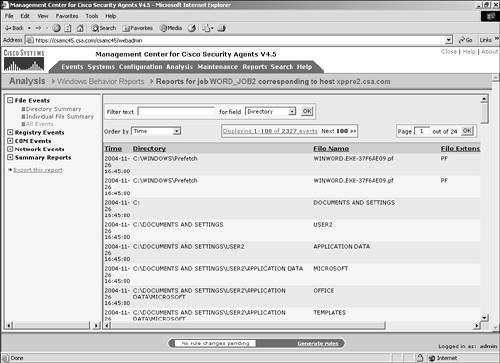 This view is limited to 100 entries per page with the option to view the next or a specific page of data. You can also filter this data by a text string within the Directory, File Name, or Process Name fields. In addition, you can sort the presented data by time, operation, file extension, or directory. The various sort and filter methods provide you with a simple and intuitive way to get to the specific data you need to view quickly and easily. Figure 11-13 shows a sample filtered view of the data collected. Figure 11-13. Filtered All Events View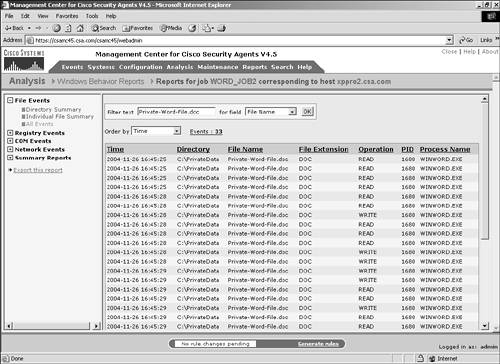 Registry EventsThe Registry Events section is divided into two sections:
To open the corresponding section and view detailed information, click that link in the navigation pane. Key SummaryThe information provided by the Key Summary portion of the Registry Events section includes the number of events affecting the registry key and the key name that was affected, as shown in Figure 11-14. Editing the Windows registry can seriously impact the usability of a system, so closely monitor this information. Figure 11-14. Key Summary Section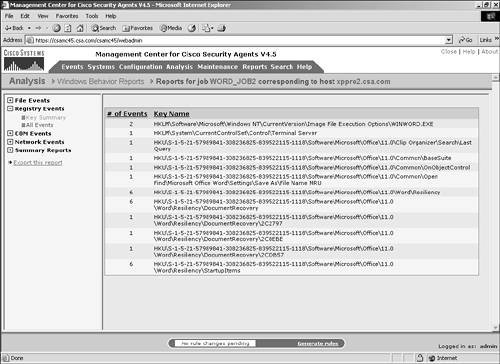 All EventsThe All Events portion of the Registry Events section provides the following information:
You can filter this data by a text value in the Key Name, Value Name, or Process Name fields, as shown in Figure 11-15. You also can sort by process, key name, or time to easily view the necessary registry access without the need for an exhaustive search. Figure 11-15. All Events Registry Section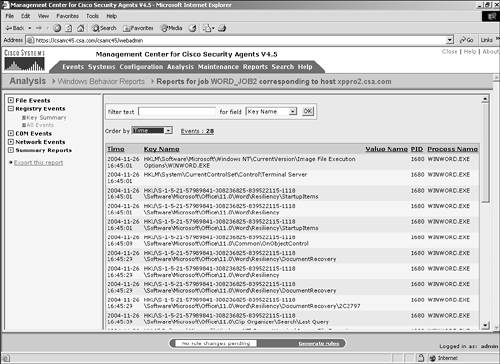 COM EventsThe COM Events section is divided into two sections:
To open the corresponding section and view detailed information, click that link in the navigation pane. Object SummaryThe Object Summary portion of the COM Events section provides information about the number of events affecting the COM object and the object name that was affected. Figure 11-16 shows a sample view of the Object Summary section. Figure 11-16. Object Summary Section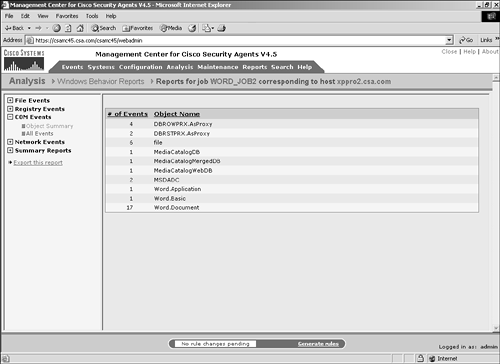 All EventsThe All Events portion of the COM Events section provides the following information:
You can filter this data by a text value in the Object Name or Process Name fields, as shown in Figure 11-17. You can sort also by process, object name, or time. Figure 11-17. All Events COM Object Section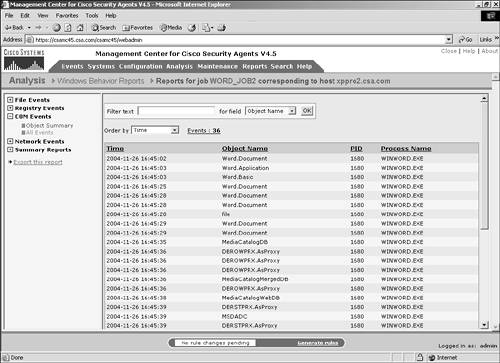 Network EventsThe Network Events section is divided into two sections:
To open the corresponding section and view detailed information, click that link in the navigation pane. Destination Port SummaryThe Destination Port Summary portion of the Network Events section provides the following information:
Figure 11-18 shows a sample view of the Destination Port Summary section. Figure 11-18. Destination Port Summary Section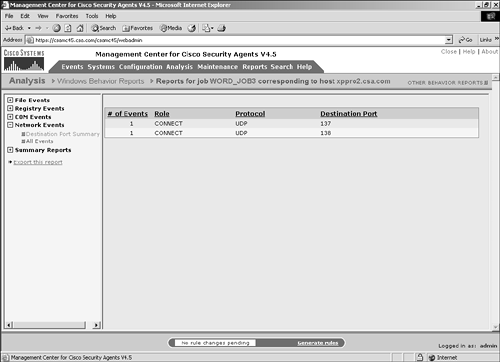 All EventsThe All Events portion of the Network Events section provides the following information:
You can filter this data by a text value in the Source Address, Destination Address, or Process Name fields. You also can sort by process, protocol, role, destination port, or time. In Figure 11-19, you can see that as part of the test of the Microsoft Word application, the transmitted file to and from a network file share uses the common Windows ports of UDP/137-138. Figure 11-19. All Events Network Section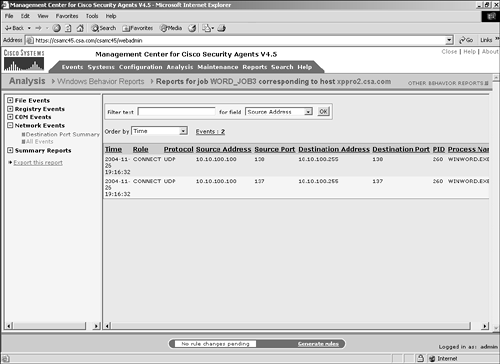 Summary ReportsThe Summary Reports section is divided into two sections:
To open the corresponding section and view detailed information, click that link in the navigation pane. Behavior SummaryThe information provided by the Behavior Summary portion of the Summary Reports section is an overall summarized view of the various events logged during the investigation and the corresponding number of events associated. As shown in Figure 11-20, the sections summarized are as follows:
Figure 11-20. Behavior Summary Section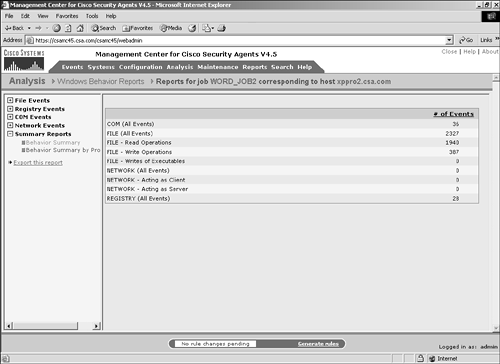 Behavior Summary by ProcessThe Behavior Summary by Process portion of the Summary Reports section provides the following information:
Figure 11-21 shows a sample view of the Behavior Summary by Process section. Figure 11-21. Behavior Summary by Process Section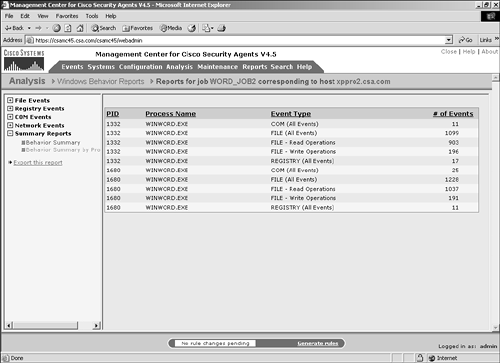 |
| < Day Day Up > |