16.6 Present and future prospects for FDI in Poland
Poland was relatively slow to attract FDI during the early years of transition, lagging behind Hungary and the Czech Republic. However since 1997 it has become the largest recipient of FDI in Eastern Europe, which is to be expected given its market size , although in terms of FDI per capita, in 1999 it ranked eighth behind many of the smaller accession countries (UNCTAD, 2000).
Early foreign investors often acted in response to supply-side factors, particularly the opportunities created by the privatization of firms. Such factors and the political economy of privatization in Poland vis-a-vis other Central European host countries explain its tardiness in attracting FDI. Later FDI inflows focused on privatization- related service acquisitions or greenfield manufacturing projects. Here Poland has performed comparatively better than its neighbours.
From 1989 until the present, Germany has been the largest investor in Poland in terms of the number of investors, with 207 projects valued above US$1 million in 2001. For several years the United States led in terms of invested capital, but in 2001 France took the lead, accounting for 19.23 per cent of total invested foreign capital in Poland, followed by the United States (14.7 per cent) and Germany (13.43 per cent). But Germany is still engaged in the largest number of projects overall (PAIZ, 2002), especially if we take into account the large number of German SME investments that are not included in the above statistics.
16.6.1 Motives for investing in Poland
There have been many studies, especially during the early years of transition, on the motives of investors, often focusing on the typologies of market-seeking and natural-resource-seeking investment. However there have been few follow-up studies and not many focus on the service sector in CEE, where investment motives are presumably more singular (Holland et al. , 2000). Meyer (1998) found that for five transition countries, including Poland, 97 per cent of investors (British and German) were attracted by local market opportunities and only 31 per cent by low factor costs in 1993 “94.3 Most of the latter also sought access to local markets.
A recent survey in Eastern Europe and other emerging markets (EBRD, 2001) found that an attractive host market ranked highest among investment motives, followed by cheap skilled labour. Access to raw materials was the least important factor. Perhaps surprisingly the survey found that investment motives varied little across the various emerging markets. The only factor with major variations was the proximity of the host and home markets. In combination with EU membership, geographical proximity and institutional convergence were found to be the most important reasons for investing in CEE countries rather than in other emerging markets. Hence EU membership cannot be viewed as unimportant in respect of attracting FDI in the future.
Overall, market-seeking has been the dominant motive in the manufacturing and service sector. What does this imply for future sectoral patterns of FDI? Does it imply that FDI will shift towards trade-related investment when market access is fully liberalized? Table 16.1 shows the industrial distribution of FDI stock and current trends, as reflected in the most recent annual inflow figures.
| Stock (US$ millions) (1) | Stock by shares (%)(2) | Share of inflow 1 (%) (3) | |
|---|---|---|---|
| Manufacturing: | |||
| Food processing | 5505.7 | 10 | 9 |
| Automobiles | 5395.0 | 10 | 3 |
| Other non-metal goods | 3060.0 | 6 | 5 |
| Electrical machinery | 1683.2 | 3 | 3 |
| Paper and paper products | 1567.3 | 3 | 2 |
| Chemicals and chemical products | 1304.6 | 2 | 1 |
| Wood and wood products | 1290.7 | 2 | 3 |
| Rubber and plastics | 612.0 | 1 |
|
| Furniture | 479.2 | 1 | 1 |
| Metals and metal products | 447.7 | 1 | 1 |
| Machinery and equipment | 271.7 | 1 | “0 |
| Textiles and clothing | 248.3 | 1 | “0 |
| Leather and leather products | 16.3 |
| “0 |
| Total | 21 1 881.7 | 41 | 28 |
| Services: | |||
| Financial intermediation 12 1 251.9 | 23 | 27 | |
| Trade and repairs | 6054.3 | 12 | 29 |
| Transport, storage and | 5710.6 | 11 | 3 |
| communications | |||
| Construction | 2764.8 | 5 | 4 |
| Social services | 1624.1 | 3 |
|
| Power, gas and water | 1491.8 | 3 | 6 |
| Real estate | 627.8 | 1 | 2 |
| Hotels and restaurants | 617.8 | 1 | “0 |
| Total | 31 1 143.1 | 59 | 72 |
| Primary: | |||
| Mining and quarrying | 87.0 |
| 1 |
| Agriculture | 40.4 |
| “0 |
| Total | 127.4 0 1 | ||
| Grand total 2 | 53 1 152.2 | 100 | 100 |
Notes : 1. The inflow in 2001 amounted to US$7.1466 billion of FDI, or 13 per cent of the total stock at the end of the year, excluding SME investments. 2. Excluding US$3.7 billion of FDI in smaller projects below US$1 million. Source: Column (1) “ PAIZ (2002).
Market-seeking investment in Eastern Europe often serves as a regional platform, while tariff jumping motivates only a few projects. Many of these investments do not focus exclusively on local markets, and market demand is viewed as the most important of a number of other factors, such as agricultural inputs for food processing or highly skilled and competitive labour in automotive and engineering-based industries. Hence a further shift towards pure trading operations is unlikely .
The synergy between cost and market attraction is likely to be enhanced by the stability and economic growth that Poland s membership of the EU is expected to generate (European Commission, 2001b). Therefore we suggest a continued trend in leading industries where investors are primarily market-seekers, with some scope for increased investment when sales operations are upgraded.
Contrary to the expectations of many (reviewed in Meyer, 2002), FDI has not been the favoured mode of exploiting advantages in labourintensive industries. This finding is supported by studies on investment motives in Eastern Europe and the industrial breakdown of Polish FDI stock in Table 16.1. It is unlikely that EU membership will change this situation fundamentally. While there are considerable opportunities for specific regions to develop specific competences and cluster advantages in particular niches in light industries, such as the wood “paper “ furniture complex in Poland, cheap labour alone cannot guarantee the sustainability of a cluster. FDI may contribute to the development of export industries employing more advanced technologies than in the past. Consequently FDI patterns may diverge across Eastern European countries as specialization increases in the region.
16.6.2 FDI and rising and declining industries in Germany and Poland
Figure 16.2 plots the investment and trade position of Germany vis-a-vis Poland, drawing on an industrial typology developed by EUROSTAT (1998), which to some extent corresponds to the FDI typology described above. Industries with a positive trade balance (from the viewpoint of Germany) and a positive FDI position are industry leaders , while industries with a negative trade balance and a positive FDI position are declining industries where export platforms will increasingly be established in the host country. FDI serves different strategic purposes in these two types of industry “ in rising industries it is mainly used as part of an offensive strategy (market or cost leadership) while in declining
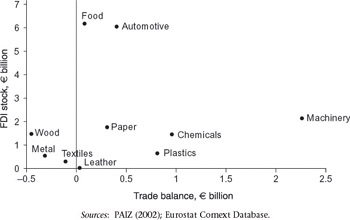
Figure 16.2: The trade and investment position of Germany vis-a-vis Poland. Sources : PAIZ (2002); Eurostat Comext Database.
industries it may be used as a defensive strategy (cost ˜ followership ). Even though the countries with the largest investment in Poland enjoyed a major trade surplus4 with the latter during the first ten years of transition, there must be a shift towards a more equitable position if the transition and accession process is to be successful. This implies that Poland will become increasingly export competitive, including in EU markets.
Note that only the trade balance registers the bilateral position of Germany vis-a-vis Poland in Figure 16.1. The FDI data on the Y-axis reflects the general industry composition of German FDI abroad.
Only three industries are presently using a defensive FDI strategy, namely metal, wood and textiles. However these are not necessarily among the industries that are likely to develop into German export platforms from Poland. With liberalization of trade in agricultural products the food industry may move towards such a position. German strongholds such as chemicals, plastics and electrical machinery can be expected to continue to be industry leaders and to maintain a high FDI profile. The extensive intra-industry trade in electrical and other machinery and equipment between Germany and Poland also suggests vertical integration. The food and automotive industries are in the strongest position in terms of FDI stock, which may provide the basis for exporting both to the west and to the east.
EAN: 2147483647
Pages: 121