Monitoring and Adjusting Costs
If your project is a budget-constrained project, you'll want to keep a close eye on the resource and task costs, and on estimated costs for the project as a whole. You'll also want to adjust your project plan if you receive any actuals that are likely to blow the budget.
| |
Cost control is the means for a project to stay within the bounds of the prescribed project budget. It involves continual monitoring of the project plan, tracking actual work and cost information, and taking corrective action where needed. If a task early in the project costs more than expected, costs might have to be trimmed in later tasks . In addition, outside forces might affect the project budget. For example, certain material costs might have gone up from the time you developed your plan to the time you're actually procuring the material. Or your company might undertake a cost-cutting initiative that requires you to cut all project costs by 15 percent.
When changes to project costs take place, you might have to adjust assignments or scope to bring costs in line with the budget. If you have a positive cost variance, the scheduled or current cost is more than your planned baseline cost. If you have a negative cost variance, the scheduled cost is less than your baseline cost. Although you certainly need to know why costs are higher than planned, you also should look into costs that are lower than planned. Lower costs can point to potential problems with increased risk, and perhaps with quality issues.
Earned value analysis is particularly useful for cost control. With variances and earned value analysis, you can assess the differences between planned and scheduled costs, determine their causes, and decide whether corrective actions are needed.
| |
Monitoring Project Costs
Use one or more of the following techniques to monitor and adjust costs so you can continue to work within your budget:
-
Display specialized views and tables to review project costs.
-
Adjust the schedule to reduce costs.
-
Adjust assignments to reduce costs.
Cross-References For more information about monitoring and adjusting costs to achieve a specific budget, see "Reducing Project Costs".
Using baseline information you saved, you can review your current costs and compare them with baseline costs. For example, you can see baseline costs for tasks (including their resource costs) next to their scheduled costs, based on actuals you entered. Then, you can review the variances between the baseline and scheduled cost. The cost variance is calculated as follows :
(Scheduled/Current) Cost “ Baseline Cost = Cost Variance
| Tip | Evaluate your cost variances and performance with earned value analysis You can use earned value calculations, such as the Budgeted Cost of Work Scheduled (BCWS) and Cost Variance (CV) earned value fields to analyze your project performance against the budget so far. |
| Cross-References | For more information, see "Analyzing Progress and Costs Using Earned Value". |
Reviewing Overall Cost Totals
There are two ways to review your overall cost totals, as follows:
-
Review project statistics. Click Project, Project Information and then click the Statistics button. Under Cost, review the current, baseline, actual, and remaining cost for the project. You can also click Project Statistics on the Tracking toolbar.
-
Add the project summary task row. In the Gantt Chart or other task sheet, click Tools, Options and then click the View tab. Select the Show Project Summary Task check box. Summary totals for task information in the current table are displayed in the project summary task row at the top of the sheet. If a table containing cost information is applied, the project summary task row shows project cost totals.
Reviewing Cost Variances
Use the Cost table to review the differences between your original baseline costs and your currently scheduled costs. The Cost table includes fields containing baseline costs, total scheduled costs, actual costs, remaining costs, and cost variances. To apply the Cost table:
-
Display the Gantt Chart or other task sheet.
-
Click View, Table, Cost.
The Cost table is applied to the current view (see Figure 11-11).
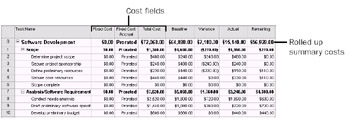
Figure 11-11: Apply the Cost table to a task sheet to see the most important cost data for tasks.
With the project summary task row applied, you can also review rolled up cost totals.
There's also a cost table for resources, which includes cost information for all the resource's assignments. With the Resource Sheet or Resource Usage view displayed, apply the Cost table. The Resource Cost table includes the baseline cost, scheduled cost, actual cost, remaining cost, and cost variance for all the resource's assignments (see Figure 11-12).
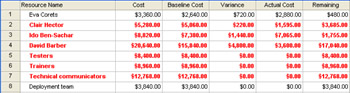
Figure 11-12: Apply the Cost table to a resource sheet to see the most important cost data for resources.
Reviewing Overbudget Costs
You can apply a filter to a task or resource sheet to see only those tasks or resources associated with overbudget costs, as follows:
-
Display the view and apply the table that contains the information you want to review in the context of overbudget costs.
-
Click Project, Filtered For, More Filters.
-
In the More Filters dialog box, click Cost Overbudget and then click Apply.
If you prefer to see all tasks or resources, but have the overbudget tasks or resources highlighted, click Highlight instead.
Microsoft Project filters for any tasks or resources whose scheduled or actual costs are higher than the baseline costs.
-
Review the tasks or resources to analyze the extent of the cost overages.
-
When you finish, show all tasks again by clicking the Filter tool on the Formatting toolbar and then clicking All Tasks.
Reviewing Cost Performance Using Earned Value Analysis
If you saved a baseline and are entering actuals, you can evaluate current cost and schedule performance using earned value calculations. To generate most earned value information, you must have the following items in your project plan:
-
A saved baseline
-
Resources assigned to tasks
-
Costs associated with assigned resources
-
Actual progress information
To review earned value information, follow these steps:
-
Display the Gantt Chart or other task sheet.
-
Click View, Table, More Tables.
-
Click Earned Value, Earned Value Cost Indicators, or Earned Value Schedule Indicators, depending on the type of earned value information you want to review (see Figure 11-13).
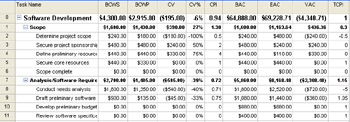
Figure 11-13: The Earned Value Cost Indicators table displays earned value fields related to budget performance.Tip See all available earned value fields You can see a list of all earned value fields available in Microsoft Project. Click Help, Microsoft Project Help (or press F1). In the Search For box, type fields and then press Enter. Click Earned Value Fields. The list of all available earned value fields appears in a separate Help window.
Click a field name to open a Help topic that gives a description of each field, how it's calculated, its best uses, and an example of its use.
Table 11-1 lists the default contents of each of the three earned value tables.
| Table name | Included fields |
|---|---|
| Earned Value | BCWS (Budgeted Cost of Work Scheduled) |
| BCWP (Budgeted Cost of Work Performed) | |
| ACWP (Actual Cost of Work Performed) | |
| SV (Schedule Variance) | |
| CV (Cost Variance) | |
| EAC (Estimate At Completion) | |
| BAC (Budget At Completion) | |
| VAC (Variance At Completion) | |
| Earned Value Cost Indicators | BCWS (Budgeted Cost of Work Scheduled) |
| BCWP (Budgeted Cost of Work Performed) | |
| CV (Cost Variance) | |
| CV% (Cost Variance Percent) | |
| CPI (Cost Performance Index) | |
| BAC (Budget At Completion) | |
| EAC (Estimate At Completion) | |
| VAC (Variance At Completion) | |
| TCPI (To Complete Performance Index) | |
| Earned Value Schedule Indicators | BCWS (Budgeted Cost of Work Scheduled) |
| BCWP (Budgeted Cost of Work Performed) | |
| SV (Schedule Variance) | |
| SV% (Schedule Variance Percent) | |
| SPI (Schedule Performance Index) |
| Cross-References | For more information about analyzing project performance with earned value, see "Analyzing Progress and Costs Using Earned Value". |
| |
If you applied an Earned Value table or inserted an earned value field only to find all the values to be $0.00, it likely that you're missing one or more of the pieces of information needed by Microsoft Project to calculate earned value fields.
For earned value to be calculated, you must have all the following items in your project plan:
-
A saved baseline
-
Resources assigned to tasks
-
Costs associated with assigned resources
-
Actual progress information
| |
Reviewing Budget Status
The following filters can help you focus on any potential problems with project costs and budget:
-
Cost Greater Than
-
Cost Overbudget (see Figure 11-14)
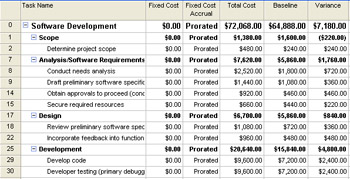
Figure 11-14: Apply the Cost Overbudget filter to quickly see which tasks are or are projected to be over budget. -
Late/Overbudget Tasks Assigned To
-
Work Overbudget
Apply a filter by clicking the arrow beside the Filter tool on the Formatting toolbar. In the Filter list, click the name of the filter you want. To show all tasks again, click All Tasks in the Filter list.
You can also run reports that provide information about costs and budget status, as follows:
-
Cash Flow
-
Budget
-
Overbudget Tasks
-
Overbudget Resources (see Figure 11-15)
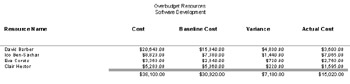
Figure 11-15: Run the Overbudget Resources report to see which resource costs are greater than the baseline resource costs. -
Earned Value
To run a cost report, click View, Reports. Double-click Costs and then double-click the report you want.
Realigning the Project with the Budget
Suppose that you reviewed your budget details against the current project costs and found that you will end up significantly over budget. Or perhaps upper management has asked you to cut costs by 10 percent, and you need to work toward a different total project cost.
If you need to take corrective actions in your project plan to reduce project costs, you can do the following:
-
Recheck your cost assumptions such as resource rates, per-use costs for resources, and fixed costs for tasks.
-
Adjust the schedule to reduce costs. Reducing task durations and adjusting task dependencies can help reduce costs.
-
Adjust assignments to reduce costs. Add, remove, or replace resources on assignments as appropriate to cut costs.
-
Cut scope to reduce costs (which will probably require stakeholder approval).
Tip Check the adjustments When you adjust your project plan to achieve the budget you need, be sure to check your finish date, resource allocation, and scope. You need to know how your changes affect other areas of the project plan.
You might also think you need to save a new baseline, especially if there have been major cost changes or changes that have affected the schedule.
Cross-References For more information about using any of these strategies to trim project costs, see "Reducing Project Costs".
Cross-References For more information on saving a new baseline, see "Need a New Baseline?" later in this chapter.
EAN: 2147483647
Pages: 268