Monitoring and Adjusting the Schedule
If you're managing a time-constrained project, there are a few pieces of task information you'll want to keep a close eye on, including the following:
-
Project finish date
-
Critical path
-
Start and finish dates of critical tasks
-
Current progress of critical tasks
If actuals have changed task scheduling to the point where your target project finish date is projected to be late, you'll need to adjust the schedule to bring that finish date back in line.
| |
It's understood that very few projects run precisely as planned. Tasks take more or less time than planned, resources discover new information, forgotten tasks are remembered , and outside forces influence the project implementation. When changes to the project schedule take place, you might have to revise durations, rearrange task sequences, or analyze what-if scenarios for your project.
Microsoft Project is an excellent tool for schedule control because it can calculate and predict the effects of any schedule changes, whether the change comes as a result of entering actual information or what-if information. Microsoft Project tracks your planned dates against your actual dates (and other schedule information). This variance analysis is key to schedule control. Analyzing variances in dates, durations, and other schedule information helps you detect where the project is diverging from your original plan. You can then predict possible delays in the schedule further down the line and take corrective actions now to offset those delays.
| |
Monitoring Schedule Progress
Use one or more of the following techniques to help you monitor progress toward your finish date:
-
Review finish dates and the critical path.
-
Check and adjust task constraints, dependencies, and durations.
-
Add resources to tasks.
Cross-References For more information about monitoring and adjusting the schedule to achieve a specific finish date, see "Bringing In the Project Finish Date".
Another method for monitoring schedule progress is to save a baseline and then compare it with the current schedule. For example, you can see baseline finish dates for tasks next to their scheduled finish dates, based on actuals you entered. Then, you can look at the variances between the baseline and scheduled finish. The finish date variance, for example, is calculated as follows :
(Scheduled/Current) Finish “ Baseline Finish = Finish Variance
| Tip | Evaluate your schedule variances and performance with earned value analysis You can use earned value calculations, such as the Schedule Performance Index (SPI) and Schedule Variance (SV) earned value fields, to analyze your project performance so far. |
| Cross-References | For more information on examining project performance, see "Analyzing Progress and Costs Using Earned Value". |
| Note | Because baseline information is vital to tracking and analyzing progress on your project, be sure to save a baseline early in the project. The ideal time to save a baseline is after you build your project plan and adjust all values to hit your target finish date, budget, and resource workload levels. Even if you realize you hadn't saved a baseline until you're well into tracking, go ahead and save a baseline at that time. Better late than never. |
| Cross-References | For more information about saving baseline information, see "Saving Original Plan Information Using a Baseline". |
Reviewing Overall Schedule Progress
Review your project statistics to get a broad view of how your project status compares with your baseline. Project statistics show your currently scheduled start and finish dates, along with their baseline, actual, and remaining values. To review your project statistics, follow these steps:
-
Click Project, Project Information.
The Project Information dialog box appears.
-
Click the Statistics button.
The Project Statistics dialog box appears. The current (scheduled) finish date appears in the Finish column (see Figure 11-1).
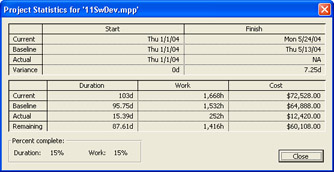
Figure 11-1: The Project Statistics dialog box shows overall project information with its currently scheduled values, baseline values, actual values, and more.Tip  Click the Project Statistics button You can also use the Tracking toolbar to quickly open the Project Statistics dialog box. On the Tracking toolbar, click Project Statistics.
Another way to keep your eye on the schedule at all times is to add the project summary task row, as follows:
-
Display the Gantt Chart or other task sheet.
-
Click Tools, Options, and then click the View tab.
-
Select the Show Project Summary Task check box.
The project summary task appears at the top of any task sheet view, including the Gantt Chart (see Figure 11-2). Task information is rolled up for the entire project, and its summary total is displayed in the project summary row. Specifically , the Finish field in the project summary row shows the latest finish date in the project. If you added additional fields or applied different tables, information is also rolled up for those fields as appropriate.
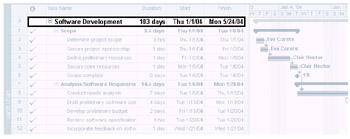
Figure 11-2: The Project Summary row rolls up task information to display the totals for the entire project.
By default, the regular Gantt Chart shows progress as a thin black line through the Gantt bar. To also see percent complete next to the Gantt bars, apply the Tracking Gantt. Click View, Tracking Gantt (see Figure 11-3).
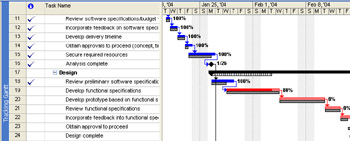
Figure 11-3: The Tracking Gantt shows the progress, the percent complete, the baseline, and the critical path in the chart area of the view.
Reviewing Schedule Variances
To review the differences between your original baseline plan values and your currently scheduled values, apply the Variance table, as follows:
-
Display the Gantt Chart or other task sheet.
-
Click View, Table, Variance.
The Variance table is applied to the current view (see Figure 11-4).
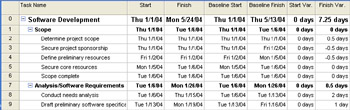
Figure 11-4: The Variance table shows the currently scheduled start and finish dates as compared with the baseline start and finish dates (including the differences between them).Tip Quickly switch tables To quickly change to a different table, right-click the Select All box in the upper-left corner of the table in a sheet view. The list of tables appears.
To quickly see the name of the current view and table, position your mouse pointer over the Select All box. A ScreenTip lists the name of the current view and table.
| |
Whenever you enter actual progress information, Microsoft Project recalculates your scheduled information based on these actuals, so you can see any effect the actual progress information has on the rest of your schedule. This also enables you to continue to see scheduled projections for the project finish date and total cost, based on performance to this point. For example, if Task A was scheduled to be finished on May 15, but it is finished on May 20 instead, you'd need to know how its successor Task B is now scheduled. This information is especially important if these are critical tasks.
If you want to keep your original start and finish dates for comparison purposes, save a baseline or interim plan before you enter the actuals. Then, add the Baseline Start and Baseline Finish to a task sheet, perhaps right next to your scheduled Start and Finish fields. If you're using start and finish dates saved with your interim plan, add Start1 and Finish1 (or whichever custom fields you used for your interim plan) to a task sheet.
| Cross-References | For more information about saving baselines, saving interim plans, and adding original field information to your task sheet, see "Saving Original Plan Information Using a Baseline". |
| |
Reviewing the Critical Path
By viewing the finish date or the critical path, you can easily see whether you're still scheduled to hit your target finish date, given the actuals you've entered. To see the critical path, click View, Tracking Gantt. If you need to bring in the finish date, you might want to focus on the critical tasks. You can filter your task sheet to show only critical tasks by clicking Project, Filtered For, Critical. To show all tasks again, click Project, Filtered For, All Tasks.
| Tip | Click the Filter tool To select a filter, you can also click the Filter tool on the Formatting toolbar. In the Filter list, click Critical. When finished, click All Tasks in the Filter list. |
| Cross-References | For more information about viewing the critical path, see "Viewing the Critical Path". |
| Note | After a critical task is completed, it becomes noncritical because it can no longer affect the completion of future tasks. |
Reviewing Task Progress
Reviewing the progress of critical tasks is the most effective means of learning quickly whether your project is staying on track with its target finish date. The following filters can help you focus on any potential problems with task progress:
-
Late/Overbudget Tasks Assigned To
-
Should Start By
-
Should Start/Finish By
-
Slipped/Late Progress
-
Slipping Tasks (see Figure 11-5)
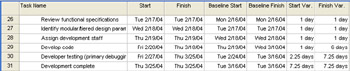
Figure 11-5: Apply the Slipping Tasks filter to quickly see which tasks are in jeopardy. -
Tasks With Deadlines
-
Tasks With Fixed Dates
To apply one of these filters, follow these steps:
-
Display the Gantt Chart or other task sheet you want to filter.
-
On the Formatting toolbar, click the arrow in the Filter tool.
In the Filter list, click the filter you want.
-
When you want to show all tasks again, click All Tasks in the Filter list.
You can also run reports that provide information about the progress of tasks, such as the following:
-
Unstarted Tasks
-
Tasks Starting Soon
-
Tasks In Progress
-
Completed Tasks
-
Should Have Started Tasks
-
Slipping Tasks
To run a report, follow these steps:
-
Click View, Reports.
-
Double-click Current Activities.
-
Double-click the report you want.
-
If a dialog box appears asking for more information, enter the information and then click OK.
The report appears in a preview window. You can zoom or print the report for a closer look.
| |
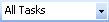
You can add the Status Indicator field to any task sheet. This field displays icons that indicate whether a task is completed, on schedule, or behind schedule.
Select the column heading next to which you want to insert the Status Indicator column. Click Insert, Column. In the Field Name list, click Status Indicator.
If you prefer to show current task status as text rather than icons, insert the Status column instead. For every task, the status of "Future Task," "On Schedule," "Late," or "Complete" appears (see Figure 11-6).
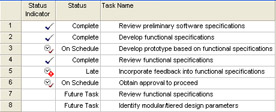
Figure 11-6: Add the Status Indicator or the Status fields to a task sheet to see task status at a glance.
| |
Working with Progress Lines
You can add progress lines to your Gantt Chart that provide a graphic means of seeing whether tasks are ahead of schedule, behind schedule, or exactly on time. Progress lines are shown for tasks that have been completed, are in progress, or are currently due. They are not shown for tasks in the future.
For any given progress date, which you can set as the status date, you can have Microsoft Project draw a progress line connecting in-progress tasks and tasks that should have started (see Figure 11-7). You can set the progress date to be the current date, the project status date, or any other date you select. You can also set multiple progress dates at recurring intervals; for example, on the first Monday of every month.
Figure 11-7: The left-pointing peaks indicate a negative schedule variance, whereas straight lines show tasks that are exactly on schedule.
Progress lines create a graph on the Gantt Chart that provides valuable progress information, as follows:
-
A progress line angled to the left indicates work that's behind schedule as of the progress line date.
-
A straight progress line indicates a task on schedule as of the progress line date.
-
Tasks untouched by the progress line are tasks starting in the future from the progress line date.
To add a progress line to a Gantt chart:
-
Display the Gantt Chart, Tracking Gantt, or any other Gantt view.
-
Click Tools, Tracking, Progress Lines.
The Progress Lines dialog box appears (see Figure 11-8).
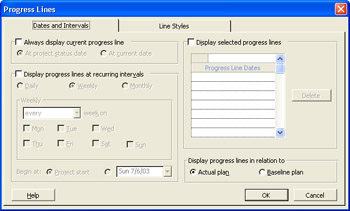
Figure 11-8: Set progress lines in the Gantt Chart using the Progress Lines dialog box. -
On the Dates And Intervals tab, select the Always Display Current Progress Line check box. Then select whether you want the progress line to be displayed at the project status date or the current date.
The project status date, as well as the current date, is set in the Project Information dialog box (Project, Project Information). If no status date is set there, the current date (today) is used instead.
-
Under Display Progress Lines In Relation To, select whether you want progress lines to reflect the actual plan or your baseline.
-
Set any other preferences for the way you want dates and intervals of dates to be represented with your progress lines.
You can enter specific progress line dates, display progress lines at selected date intervals, and so on (see Figure 11-9).
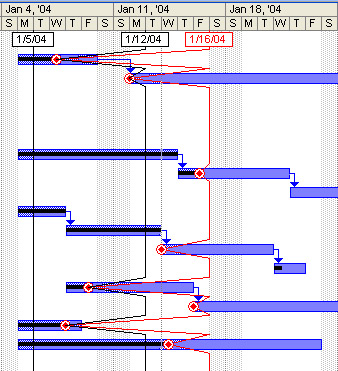
Figure 11-9: Specify as many progress lines as you need for your purposes. -
Click the Line Styles tab, and set your preferences for the way you want the progress lines to appear in the Gantt Chart.
You can specify the line type and color and the progress point shape and color for the current progress line and other progress lines (see Figure 11-10 on the following page).
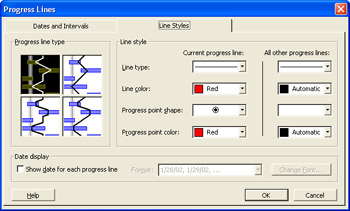
Figure 11-10: Use the Line Styles tab in the Progress Lines dialog box to customize the way progress lines appear in your Gantt Chart.Tip  Click the Add Progress Line button You can also use the Tracking toolbar to quickly add a progress line. On the Tracking toolbar, click Add Progress Line. A pop-up appears, and the mouse pointer changes to the progress line icon:
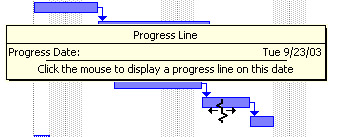
In the chart area of the Gantt Chart, click where you want the progress line to be added. The Progress Line pop-up shows the exact date you're pointing at.
If you have defined progress line dates in addition to the status date or current date, you can choose to show them only when you want. For example, you might want to show progress lines in a printed view for a status meeting, but hide them while updating progress. To temporarily hide progress lines:
-
Click Tools, Tracking, Progress Lines.
-
Make sure the Dates And Intervals tab is showing.
-
Clear the Display Selected Progress Lines check box.
The defined progress lines are removed from your Gantt Chart, but the dates remain in the Progress Lines dialog box for when you want to show them again.
You can remove one or more of your defined progress lines. To delete a progress line:
-
Click Tools, Tracking, Progress Lines.
Make sure the Dates And Intervals tab is showing.
-
Under Progress Line Dates, select the progress line you want to remove from the Gantt Chart and then click the Delete button.
To hide the current progress line reflecting the project status date or the current date:
-
Click Tools, Tracking, Progress Lines.
The Progress Lines dialog box appears.
-
On the Dates And Intervals tab, clear the Always Display Current Progress Line check box.
Correcting the Schedule
Suppose that you reviewed your schedule details and found that your project isn't going as quickly as planned and the finish date is in jeopardy. Or perhaps upper management has imposed a schedule change, and you need to work toward a different finish date.
If you need to take corrective actions in your project plan to bring in the scheduled finish date, you can do the following:
-
Check schedule assumptions ”such as duration, constraints, and task dependencies ”to see whether any adjustments can be made.
-
Add resources to recover a slipping schedule (this will likely add costs).
-
Cut scope to recover a slipping schedule (this will probably require stakeholder approval).
Cross-References For more information about using any of these techniquest to adjust the schedule to meet the current or new finish date, see "Bringing In the Project Finish Date".
| |
Suppose that an external change is being proposed, or you just want to see the effect of a potential change to your project plan. You can save another version of your project plan and make the necessary adjustments to reflect the potential change. You can then examine specifically what the imposed changes will do to your project plan in terms of schedule, cost, and resource allocation.
To save a what-if project, click File, Save As. In the File Name box, enter a name for the what-if project and then click OK.
You can change the what-if project as much as you like. Because you saved it under a different filename, your working version of the project plan remains intact, but you gained valuable information about the impact of potential change.
If you or other stakeholders decide to go ahead with the change, you can adopt the what-if project as your new working project.
| |
| Tip | Check the adjustments When you adjust your project plan to achieve the finish date you need, be sure to check costs, resource allocation, and scope. You need to know how your changes affect other areas of the project plan. You might also think you need to save a new baseline, especially if there have been major schedule changes. |
| Cross-References | For more information on new baselines, see "Need a New Baseline?" later in this chapter. |
EAN: 2147483647
Pages: 268
- Step 3.2 Use PuTTY / plink as a Command Line Replacement for telnet / rlogin
- Step 3.4 Use PuTTYs Tools to Transfer Files from the Windows Command Line
- Step 4.3 How to Generate a Key Pair Using OpenSSH
- Step 4.7 Using Public Key Authentication for Automated File Transfers
- Step 6.2 Using Port Forwarding Within PuTTY to Read Your E-mail Securely