Building a Report
This section describes a simple example that uses an internal report to display student test scores. The report’s data is taken from an Access database containing two tables.
The Students table contains the fields LastName, FirstName, and StudentId. The Scores table contains the fields StudentId, TestNumber, and Score. The StudentId field provides the link between the two tables.
Figure 25-2 shows the desired result. Each student’s scores are grouped in a separate section that ends with the student’s average score. The report as a whole ends by displaying the class average.
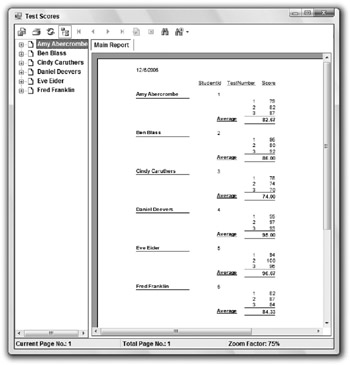
Figure 25-2: This report displays students’ test scores.
To build the example program, start a new Windows application project. First you must define the report. Open the Project menu and select the Add New Item command. Select the Crystal Report template and enter a meaningful name for the report file, as shown in Figure 25-3.
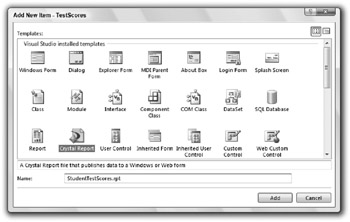
Figure 25-3: To create a report, select the Crystal Report template.
When you click Add, the Crystal Reports Gallery shown in Figure 25-4 appears. You can use the gallery to build a blank report, a report based on an existing report, or a report built by a wizard. For this example, select the Using the Report Wizard option and the Standard expert, and click OK.
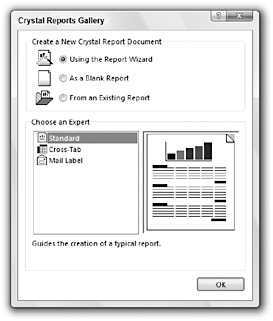
Figure 25-4: Select the report type from the Crystal Reports Gallery.
The Standard Report Creation Wizard, shown in Figure 25-5, starts by letting you define the report’s data source. Use the Available Data Sources display on the left to select the data source. To create a new data source, open the Create New Connection item. Then expand the appropriate connection type. For this example, which uses an Access database, you would click the Database Files item. If that item does not already contain any references to databases, clicking it displays a file selection dialog box that lets you select a database file. If the Database Files entry contains databases, select one or double-click the Find Database File item to look for a database.
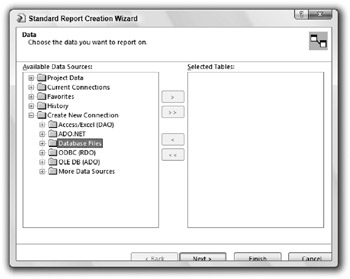
Figure 25-5: The Standard Report Creation Wizard’s Data step lets you define the report’s data source.
Expand the data source that you want to use for the report. Select the tables that you want to use and click the right-pointing arrow buttons to select the tables. In Figure 25-6, I selected the highlighted database file and then clicked the double right arrow button to move all of its tables into the selected list.
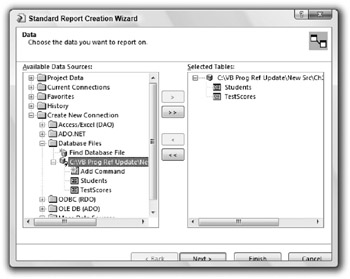
Figure 25-6: Select the tables that you want to use in the report.
After you finish selecting tables, click the Next button to see the link diagram shown in Figure 25-7. Drag the tables into convenient positions. Then click and drag the StudentId field from the Students table onto the StudentId field in the TestScores table. This defines the relationship between the two tables. If you click Auto-Arrange, the wizard will rearrange the tables to make the diagram look nice.
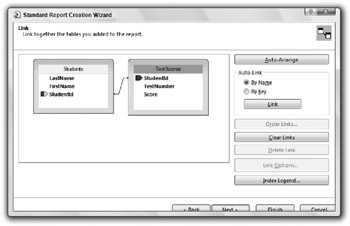
Figure 25-7: Use the Link page to define links between tables.
Click Next to see the Fields page shown in Figure 25-8. Select the fields that you want to display and click the > button to move them to the Fields to Display list. In Figure 25-8, the Students table’s FirstName, LastName, and StudentId fields are selected, together with the TestScores table’s TestNumber and Score fields. The TestScores table’s StudentId field is not selected because it duplicates the value in the Students table’s StudentId field.
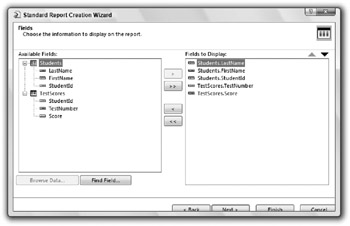
Figure 25-8: Use the Fields page to select the fields displayed by the report.
When you click Next, the wizard displays the Grouping page shown in Figure 25-9. Here, you can select fields that should be used to group results. In Figure 25-9, the Students.StudentId field has been selected as the primary group. When the report runs, it will group together all of the records for each student. The figure also selects the TestScores.TestNumber field. This ensures that the values in this field will be sorted.
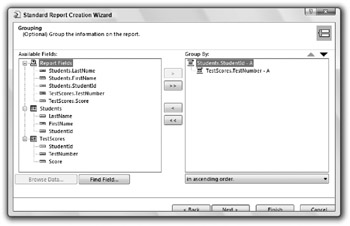
Figure 25-9: Use the Grouping page to determine how the report groups records.
Click Next to display the Summaries page shown in Figure 25-10. This page lets you add summary information to the report. Initially, the page displays some rather odd selections (including the sums of the StudentId, TestScore, and TestNumber values). It’s hard to imagine wanting to add up all of the test numbers.
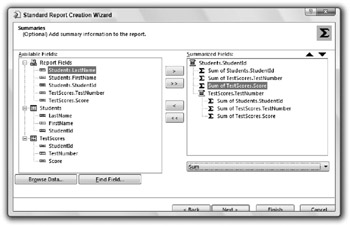
Figure 25-10: The Summaries page lets you add summary information to the report.
In the upper group, select the sum of TestScores.Score and use the drop-down on the lower right to select Average instead of Sum. Remove the other summary fields.
Click Next to display the Group Sorting page shown in Figure 25-11. You can use this page to sort groups based on their summary data. For example, you could sort students based on their average test scores. This example doesn’t sort the groups by summary data, so they will appear sorted by the group field StudentId. (Go back to Figure 25-9 and note that the drop-down on the lower right says that the group will be sorted in ascending order.)
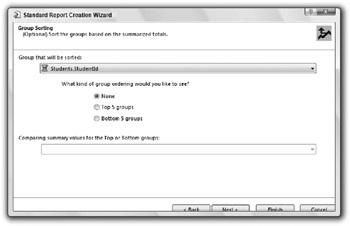
Figure 25-11: Use the Group Sorting page to sort the items in groups.
When you click Next, the wizard displays the Chart page shown in Figure 25-12. Select the type of chart you want to add to the report. Figure 25-12 is shown selecting a bar chart, but this example assumes that you don’t want any chart, so select the No Chart option before continuing.
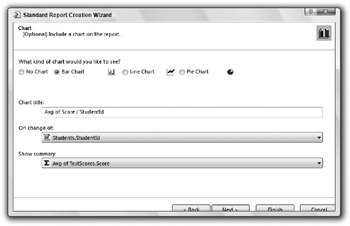
Figure 25-12: Indicate the kind of chart you want to add to the report, if any.
After you select a chart type, click Next to display the Record Selection page shown in Figure 25-13. This page lets you filter the records that are selected for the report. Move the fields you want to use to select records to the list on the right. Pick the selection operator you want to use in the drop-down below the list. If the operator requires extra data, additional fields appear below the drop-down.
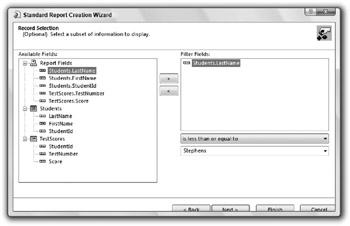
Figure 25-13: Use the Record Selection page to filter the records included in the report.
For example, in Figure 25-13 the selection operator is “is less than or equal to.” When you select this operator, another drop-down list appears to let you enter a value to compare to the Students.LastName field. The wizard populates the drop-down list with Students.LastName values taken from the database.
Figure 25-13 shows a record selection field selected, but this example assumes that you want all of the records, so remove this field before you continue.
When you click Next, the wizard displays its final page, the Report Style page shown in Figure 25-14. Select a style and click Finish.
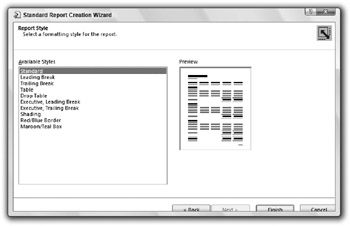
Figure 25-14: The Report Style page lets you pick report formatting options.
Figure 25-15 shows the resulting report in the development environment. The horizontal gray bars indicate the report’s different sections. These include report headers and footers, page headers and footers, group headers and footers, and a details section inside the innermost group.
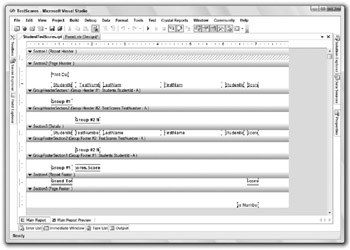
Figure 25-15: You can modify the report in the development environment.
Within each section, text surrounded by brackets indicates labels and text fields on the report. When the report executes, it will fill these in with values taken from the database.
Later you may need to change the data source for a report. For example, if you install this book’s source code that is available for download on the book’s web site (www.vb-helper.com/vb_prog_ref.htm), you may want to place the code in a location other than the one I used when I wrote the example programs. In that case, you’ll need to tell the report where to find the database.
To do that, double-click the report in Solution Explorer to open it. Right-click the report, open the Database submenu, and select the Set Datasource Location command to open the dialog box shown in Figure 25-16. The bottom area lets you select the new data source much as you initially selected it in Figure 25-6. Select the new data source and click the Update button.
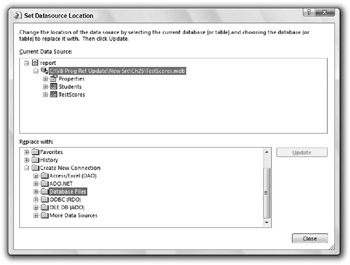
Figure 25-16: This dialog box lets you change a report’s data source.
EAN: N/A
Pages: 417