The Stock Portfolio Spreadsheet
Now that you know how property binding works, let's examine the specific use of property binding in the Real-Time Stock Portfolio solution. It might be helpful to run the solution as you read the rest of this chapter so that you can follow along and see it in action.
The stock portfolio spreadsheet is logically divided into two sections: The top part is the real-time information and is where the property-binding formulas are located. The bottom section is for building a personal portfolio, and the cells in that section retrieve current prices from the Last Sale cells in the upper section. The Totals row at the bottom of the spreadsheet provides net worth totals for the entire portfolio. You can insert new rows into either section to track more symbols or to add more items to your portfolio—just remember to copy the formulas from the previous row's cells to the new row. Figure 10-3 depicts the stock portfolio spreadsheet model.
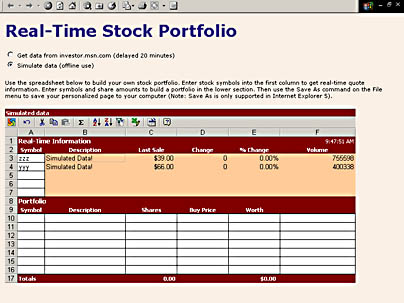
Figure 10-3. The stock portfolio spreadsheet.
I used Microsoft FrontPage 2000 to create this page and the spreadsheet model within it. I set the ViewableRange property to A1:F17 and set the AutoFit property to True, causing the Spreadsheet control to automatically resize to the width and height of the viewable range. Because I did not protect the spreadsheet, you can view any of the cell formulas and insert or delete columns or rows from the spreadsheet. The interesting formulas are in the B3:F7 range. Let's look at the formula in C3:
=IF(ISBLANK(A3),"",document.stockticker.quote(A3).LastSale) |
The formula first checks to see whether the leftmost cell in the row (A3) is blank. If it is, the formula puts a blank string into the cell. If not, the formula establishes a property binding with a control that has the ID "stockticker". (For a refresher on the property-binding syntax, see Chapter 2.) The formula binds to the LastSale property of the object returned from the stock ticker's Quote method. The Quote method accepts a stock symbol as a parameter and returns a Quote object for that symbol. I will describe the Stock Ticker control and the Quote object in more detail in the next section. In the meantime, note that you can use cell references in a property binding. In this case, I use the value from A3 as the parameter to the Quote method. When the Spreadsheet control requests the current value of the LastSale property, it passes the current value of A3 as the input argument to the Quote method. If the value of A3 changes, this cell (C3) is considered a dependent and the Spreadsheet control will automatically recalculate C3, passing the new value of A3.
The portfolio section of the spreadsheet uses the VLOOKUP function to find the symbol you entered in column A and retrieve the symbol description and current price. For example, the formula in cell B11 looks like this:
=IF(ISBLANK(A11),"",VLOOKUP(A11,$A$3:$B$7,2,FALSE)) |
If the value in the leftmost cell in the row (A11) is blank, this formula makes B11 blank as well. If A11 contains a symbol, the formula passes four arguments to the VLOOKUP function: the value of A11, the range where the real-time symbols and descriptions lie ($A$3:$B$7), the column index 2, and a flag indicating that I want an exact match. The second argument to the VLOOKUP function is a range. VLOOKUP searches the first column in this range for the value passed to the first argument. If it finds a match, it returns the corresponding value in the second column of the range, which in this case is the symbol description.
EAN: 2147483647
Pages: 111
- ERP Systems Impact on Organizations
- Enterprise Application Integration: New Solutions for a Solved Problem or a Challenging Research Field?
- The Effects of an Enterprise Resource Planning System (ERP) Implementation on Job Characteristics – A Study using the Hackman and Oldham Job Characteristics Model
- Distributed Data Warehouse for Geo-spatial Services
- A Hybrid Clustering Technique to Improve Patient Data Quality