PivotTable Component Terminology
One of our goals while designing the PivotTable component was to make the user interface and programming model consistent between tabular and multidimensional data sources. Although each type of data source has special requirements, we wanted the aspects of the two that overlapped to look and feel the same.
At the same time, we thought that the terminology commonly used in the OLAP world was less than intuitive for businesspeople who simply want to retrieve the data they need to perform their jobs. Fortunately, the Excel PivotTable report feature has established a set of standard terminology with which many users are already familiar. We followed the terminology established by Excel, but changed just a few names where there was a better term to express the concept in the worlds of both tabular and multidimensional data.
The terminology presented here is the terminology I will use throughout the rest of the book, and it is the terminology used in the programming model of the PivotTable control. I will explain what each of these terms represents in the control and what the term maps to in both the tabular and multidimensional data source terminology.
Figure 4-14 shows a typical PivotTable report and highlights various elements defined in the following sections. Refer to this diagram to see where the PivotTable control displays a particular element.
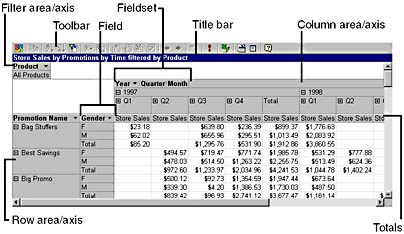
Figure 4-14. Various elements of a PivotTable report.
Totals
For a tabular data source, a total is an aggregation (sum, count, minimum, or maximum) of the detail values in a field. Totals are created using the AutoCalc toolbar button or the programming model. By default, a tabular data source has no totals since the source data is merely a set of rows. You can create multiple totals for any field using the Sum, Count, Min, or Max summary functions. (Text-based fields can only be counted.) You also can delete any totals you create by using either the context menu in the PivotTable Field List or the programming model.
For an OLAP data source, a total is a collection of values and aggregates that represent a measure in the hypercube. All measures exposed from the OLAP provider will be available to the PivotTable report, and you can include any set of them. Unlike using the tabular data source, you cannot create additional totals when connected to an OLAP data source. If you want a calculated total (such as Store Sales Net = Store Sales - Store Cost), you must create a calculated measure in the hypercube. This measure will be exposed as a total in the PivotTable control.
You can place totals only in the data area (the center) of the PivotTable control, and they typically generate all the numbers in a PivotTable report. The totals available to view are displayed separately in the PivotTable Field List, with a unique icon denoting that they are indeed totals.
Fieldsets and Fields
The term "field" is often used to describe a column in a tabular data resultset, and it seems to be the predominant term used in Microsoft products. Although I prefer the term "column," Microsoft Access and Excel have too much history using "field." For this reason, the Office Web Components use field and fieldset to describe a result column for a tabular data source. For an OLAP data source, field is used to describe a level and fieldset is used to describe a hierarchy. A fieldset is a collection of related fields that belong together in a hierarchy—for example, the Geography fieldset might contain the fields Country, State, and City.
A tabular data source returns a resultset containing a set of completely unrelated fields. In other words, you cannot know universally that any particular field belongs with any other field in a hierarchy. For example, if you have both a Country and a State field in a resultset, there is no metadata indicating that the two fields are levels of a single hierarchy. For this reason, when using a tabular data source, every result field is independent in the PivotTable control and is therefore a fieldset with just one field. The exceptions to this rule are date fields and date/time fields. When the PivotTable control encounters a date field in the resultset, it automatically generates two additional fieldsets that provide a calendar-based time hierarchy for the field. One fieldset contains the fields Year, Quarter, Month, and Day while the other contains the fields Year, Week, and Day. The PivotTable control creates these two extra fieldsets for each date or date/time field in your tabular resultset. Unfortunately, you cannot create your own fieldset hierarchies from a set of result fields in this version of the control.
When using an OLAP data source, the PivotTable control creates a fieldset for each hierarchy in the hypercube. Some OLAP databases allow you to define multiple hierarchies for a single dimension. The PivotTable control will expose each hierarchy as a separate fieldset. Each fieldset contains one field for each level in the OLAP hierarchy, skipping the All level if it exists.
Members
A fieldset in the PivotTable control contains a set of members, one for each distinct category in each of its fields. Members are displayed as row or column headings in a crosstab report and are frozen to scrolling so that they are always visible.
When using a tabular data source, the PivotTable component creates a member for each distinct value in each result field. It also creates a member called (Blank) if it finds any Null or blank values in a given field.
When using an OLAP data source, the PivotTable control creates a member for each element in each hierarchy, including the All member if it exists.
Row, Column, Filter, and Data Areas (Axes)
The PivotTable control has a few areas that you can use to construct your report. Areas often are called axes in the programming model. OLAP databases also use the term "axis" to describe part of a query result. The row area is the region to the left of the control where the row headings are displayed and on which you can drop a field to group your data by rows. The column area is the region across the top of the control where the column headings are displayed and on which you can drop a field to group your data by columns. You can place as many fields in these two areas as you want, limited of course by your available system resources.
The filter area is the strip across the top of the control. This area is where you place fields that you want to filter by, choosing one value at a time. For example, you might want to see sales information for one product line, one country, or one salesperson. The data in the report is filtered to show the totals attributed to only the selected member. You can place as many fields in the filter area as you want, and if you want the totals for all members in the field, select the "(All)" member. When using a tabular data source, the selection you make in a filter field is used as a local filter on the client, meaning that the PivotTable control still has all the detail data on the client and is simply filtering the data locally. If you want to filter the data at the server, you must use a WHERE clause in the command text used to populate the PivotTable report.
The data area is the region in the center of the report where the PivotTable control displays totals. Totals placed in this area will cause the PivotTable control to display numbers for the intersections of row and column members. You can add as many totals to the report as you want. The numerical values are displayed in separate columns by default.
The data area also is capable of showing any detail rows that are available for a given total. This capability is of course available only when the data source is tabular because OLE DB for OLAP data sources return only aggregates, not the detail source data behind those aggregates. When working with a tabular data source, the PivotTable control can display the detail data behind any aggregate by expanding the aggregate cell and showing the detail rows in place. This allows the user to simply double-click a number about which he or she wants to see more detail, causing the PivotTable to expand the cell occupied by that number and show the detail data rows contributing to that aggregate.
UniqueName, Name, and Caption
When you start writing code using the PivotTable component's programming model, you will notice that many objects have three properties related to their identity. Each of these properties does in fact represent something different.
The UniqueName property of an object returns its unique name as reported by the data source. Many OLAP data sources have a method for creating unique names for members, levels, dimensions, and so on, and these names are hardly fit for anyone to see. Unique names are intended to be opaque strings that you retrieve and use without trying to understand their internal format; however, they are guaranteed to uniquely identify the object. An example of a unique name from OLAP Services is "[Time].[All].[1997].[Q1]". You can use the unique name of an object when looking it up in a collection or when setting a filter. Often it's safest to do so because this disambiguates cases in which you might have the same member name at two different levels in a single hierarchy or at the same level, as with Portland, Maine and Portland, Oregon. Both of these members have the same name ("Portland"), but their unique names are different ("[USA].[Maine].[Portland]" vs. "[USA].[Oregon].[Portland]").
The Name property of an object is friendlier than the UniqueName property, but it is still intended to identify an object in a collection. The Name property is initialized to the value of the object's Caption property, but the Name property will not change if you change the Caption property for display purposes. The Name property also can be used to look up an object in a collection or when setting a filter, but you should use it only if you know that you do not have multiple members with the same name in a hierarchy.
You use an object's Caption property when displaying the object in the report. You should not use it to look up an object in a collection or when setting a filter. For instance, if your report has a total named Sum of ExtendedPrice, you might want to adjust it to Sales in the report since that name is easier to read. Changing the Caption property has no effect on the internal names of objects, but it will change what is displayed in the report.
EAN: 2147483647
Pages: 111