Making Your Content Up-to-Date With Live Data
Live data is data that you view on the Web that is not static, but drawn from a database, and presented on a Web page in response to your request. You get a view of the data on the Web page, and the part of the Web page on which the data appears is called a Data View. The source of the live information you view is a database, which is called a Data Source. These two elements ”Data Views and Data Sources ”are illustrated in Figure 16-1:
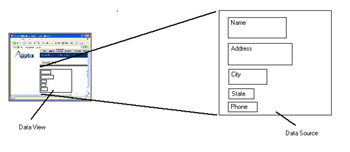
Figure 16-1: When you add a Data View, you present live content drawn from a Data Source.
FrontPage gives you lots of ways to view live data. You can:
-
Create data-enabled Active Server Pages (ASP)
-
Create an ASP.NET site. A Web site based on ASP or ASP.NET can use a data source such as Microsoft Office Access 2003.
-
Create a data-driven Web site using Windows SharePoint Services
You then run either the Database Results Wizard or the Database Interface Wizard to create Web pages that present the database contents online and let you interact with them. The option you choose depends on which technology is available on your Web server.
The best way is to use a site based on Windows SharePoint Services. This enables you to access a wide range of data sources, including desktop-based and server-based databases, XML files, Web services, and SharePoint lists. When you create a data-driven Web site, you select data sources from a data source catalog and use Data View Web Parts to present data. Data View Web Parts render data by using Extensible Stylesheet Language Transformation (XSLT).
| Note | All of the options related to Data Views, Data Source Catalogs, and Web Parts presented in this chapter require your Web site to be hosted on a server that makes use of Windows SharePoint Services. The following technologies are required on your Web server: Microsoft Windows Server 2003, Standard Edition, Enterprise Edition, Datacenter Edition, or Web Edition; Microsoft Internet Information Services (IIS) 6.0 in IIS 6.0 worker process isolation mode, and ASP.NET. Check with your ISP or Web host to make sure these services are available. |
Presenting Live Data by Inserting Data View Web Parts
The first step in creating a Web page that is designed to present live data is to create a Data View. A Data View performs two functions: it displays data on the current Web page, and also provides other members who have access to the Windows SharePoint site to post their own data by filling out the simple form that appears in the Data View when the page is viewed with a browser.
| Lingo | The term Data View is actually short for Data View Web Part . A Web Part is a modular unit of information that makes up part of a SharePoint Web page. Multiple Web Parts can be enclosed within an area called a Web Part Zone that is invisible when the page is viewed in a browser but that appears as a dotted line in the FrontPage window. |
The advantages of using Windows SharePoint and FrontPage are speed and convenience: you only need to choose a single menu option to make a link between the current Web page and a data source. Without SharePoint, you need to create the data source, create a database connection to the data source, and then create the Web page that is designed to display the data. Rather than having to follow all of these steps, you only need to:
-
Open the Web page on which you want to present the Data View. Make sure you are in Design view, and that you are in a Web site that uses Windows SharePoint Services.
-
Position the cursor where you want the new Data View Web Part to appear. If you position the cursor beneath the current Web Part Zone, it will be in a separate zone. If you click the label Left at the top of the Web Part Zone to select the Zone itself, you can add the new Data View Web Part to the current zone.
-
When you are ready, choose Data, Insert Data View.
-
When the Data Source Catalog task pane appears (see Figure 16-2 on the following page), make a selection from the set of data sources: SharePoint Lists, SharePoint Libraries, database connections, XML data sources, and more. (See the section Working with the Data Source Catalog later in this chapter for more information.)
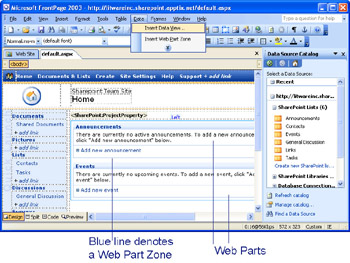
Figure 16-2: The Data View menu option and Data Source Catalog task pane are available when you are working on a Windows SharePoint Services site.
Once you add a data view, you can format it as described in the following section.
| Caution | Each Data View Web Part within a Web Part Zone is enclosed by an orange box when you view it in FrontPage Design View. The Web Part Zone itself is enclosed by a blue box. Don t select an existing Web Part Zone when you create a new one ”you ll delete the previous Web Part Zone when the new one is inserted. |
Speeding Up Formatting by Inserting Data View Styles
One of the advantages of using Data Views is the ability to make data look the way you want from directly within FrontPage, and see exactly how it will look in a Web browser. Rather than having to launch and use a database application, you can format a Data View using FrontPage s formatting options: right-click the Data View, choose Web Part Properties, and change the formatting options in the properties dialog box that appears (see Figure 16-3).
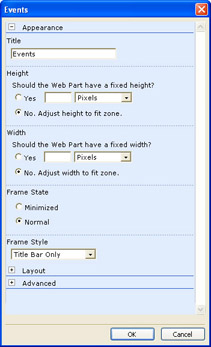
Figure 16-3: You can change a Data View s visual appearance by choosing from these options.
Browse through Preset Data View Styles
You gain a lot more control over formatting, as well as a preview of how the elements within a Data View are arranged, by applying a preset style. Follow these steps:
-
Single-click the Data View you want to format to select it.
-
In the Data View Details task pane, under the heading Manage View Settings, click Style.
-
When the View Styles dialog box appears, scroll down the list of layout options in the HTML view styles box. Click each option to read about it under the heading Description (see Figure 16-4).
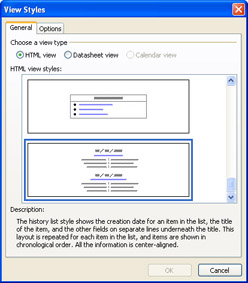
Figure 16-4: Preview and quickly choose a layout style for a Data View from this list. -
When you ve chosen an option you like, click to select it.
-
If you want to add a toolbar to a Data View that enables your co-workers to perform functions such as posting or sorting items, click the Options tab, and select the box next to Show Toolbar With Options For.
-
When you re done, click OK.
| Note | It s worth taking a detailed look through all of the styles to find the one that s right for you. Don t overlook the ones at the bottom of the lengthy list. The History option, for instance, is especially good if you have a lot of events or comments posted, and you want to arrange them chronologically. |
Applying Conditional Formatting
Dynamic conditional formatting enables you to change the visual characteristics of data, if certain conditions are met. It s the feature to use if you want your Web site to highlight information, so that you and your co-workers can make decisions based on important criteria. Apply conditional formatting when you need to be alerted to anomalies within a set of values. In a set of sales figures, you might want to highlight particularly good results. For example, you can display values that are less than $100 in red and values greater than $1000 in green. You can also decide whether to show or hide items, based on conditions such as their value, or their position in the data view. To apply conditional formatting to a Data View, follow these steps:
-
Click to select the element in the Data View that you want to format.
Note Click carefully : Selecting the entire Data View does not display the Conditional Formatting option in the task pane. Rather, you need to select an individual field within the Data View that you want to format.
-
Click Conditional Formatting in the Data View Details task pane.
-
When the Conditional Formatting options appear in the task pane, click Create, then choose one of the three options that appear (see Figure 16-5).
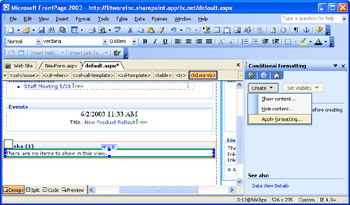
Figure 16-5: Conditional formatting can cause content to be shown, hidden, or appear in a special way.-
Choose Show Content if you want the conditions to cause the content to be visible when the Web page is viewed in a browser.
-
Choose Hide Content if you want the conditions to cause the content to be hidden when the Web page is viewed in a browser.
-
Choose Apply Formatting if you want special formatting (such as a color ) to be applied when the conditions are met.
-
-
When the Condition Criteria dialog box appears (see Figure 16-6), click Click Here To Add A New Clause.
-
When a drop-down list appears under Field Name , choose Rows or Status.
-
When a drop-down list appears under Comparison, choose one of the list options (Equals, Greater Than, Contains, Does Not Contain, and so on.)
-
When a drop-down list appears under Value, either select a value from the list, or choose the blank option at the bottom of the list and type your own content. For this example, type the word Announcement . Click OK when you re finished.
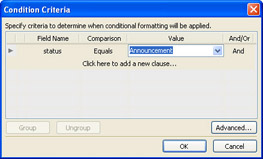
Figure 16-6: Establish the criteria for the formatting you want to apply. -
When the Condition Criteria dialog box closes , the Modify Style dialog box automatically appears. Click Format, and choose an item (Font, Paragraph, Border, Numbering, or Position) that has the formatting you want to apply.
For instance, if you want to format the word Announcements in red and all caps when it appears, click Font. When the Font dialog box appears, choose red from the Color drop-down list, select the box next to All Caps, then click OK. Click OK again to close the Modify Style dialog box.
When you re done, the conditional formatting you have specified appears under the heading Existing Conditions in the Conditional Formatting task pane. You can modify the conditions, or add new ones, if you wish. Click Set Visibility if you want to change the formatting immediately by making it visible or hidden.
Sorting, Filtering, and Grouping Data
Anything you can do to analyze data more quickly will boost your productivity and enable you to create more accurate reports . Sorting, filtering, and grouping are three basic ways of analyzing data; FrontPage gives you the ability to perform such analysis without having to launch a separate database application:
-
Sorting enables you to find the highest or lowest data value in a set of records, or rank values in order.
-
Filtering displays only data that matches the filter condition ”perfect for focusing your attention on specific records within a data source.
-
Grouping enables you to view a set of records that are in proximity to one another ”all the cells in a row, for instance.
Sorting, grouping, and filtering gives you the ability to help your colleagues by allowing them to see only the information that is most relevant or urgent. By editing your SharePoint Services site s contents, you make the site more useful, and increase the chances that your colleagues will actively participate by sharing their own information. Just follow these steps:
-
Right-click the Data View you want to format, and choose Data View Properties from the shortcut menu.
-
When the Data View Details task pane appears, click Filter.
-
When the Filter Criteria dialog box appears, click Click Here To Add A New Clause. See Steps 4 through 8 in the preceding section on Conditional Formatting to learn how to set the criteria; the process is basically the same.
-
When you re done filtering, click Sort And Group in the Data View Details task pane.
-
In the Sort And Group dialog box (see Figure 16-7), select options from the Available Fields list. (These are the fields that are contained in the Data View you are formatting.) Click Add to move each to the Sort Order column.
-
Click each of the items you have moved to the Sort Order column, and click Move Up or Move Down to change the order. Click OK to close Sort And Group.
-
When you re done, click OK.
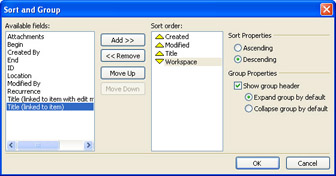
Figure 16-7: Sort and group items in a Data View, so that you and your colleagues see only the most important contents.
Connecting Web Parts
By default, a Data View that you add to a SharePoint Services Web page is a standalone Web Part. When someone adds a link, announcement, task, or other bit of information to share with the other members of the workgroup, the contents of that Web Part alone change. Any other Web parts on the page stay the same.
Web Part pages become more interactive and useful when they are connected ”the contents of one part change in response to a change in another part. Connecting Web Parts enables you to create sophisticated scenarios on a single Web page. One part can contain a master list of categories or topics (for example, a list of employees ), and when the viewer chooses one of those items, the corresponding details appear in another Web Part (such as a set of contact information for the selected employee). To connect one Web Part to another, follow these steps:
-
Right-click one of the Web Parts that you want to connect, and choose Web Part Connections from the shortcut menu.
-
When the Web Part Connections Wizard appears, make sure Provide Data Values To Another Web Part is chosen under Choose The Action on the source Web Part To Use For This Connection, then click Next.
-
When the next screen of the Wizard appears, choose to connect to either a Web Part on this page or in the current Web. If you choose a Web Part on another page, click Browse to locate the page. Then click Next.
-
When the next screen of the Wizard appears (see Figure 16-8), choose the Web Part to which you want to connect from the Target Web Part list. Then, choose an action from the Target Action list, and click Next.
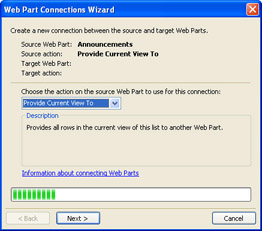
Figure 16-8: You can make a change in one Web Part affect the data in another Web Part. -
In the next screen of the Wizard, select the columns containing data that will change in the two Web Parts that you want to connect. Click Next.
-
In the next screen of the Wizard, create a hyperlink connecting one part to the other. Click Next, then click Finish to establish the connection.
Once you have connected the two Web parts, it s a good idea to click File, Save to save your changes, and then preview the Web page in a browser, so you can test the connection to see if it works the way you want it to.
Creating a Web Part Zone
Web Parts can stand by themselves on a Web page. But when you group them with other Web Parts in a container, called a Web Part Zone, you give your co-workers added functionality. By creating a Web Part Zone, you give users the ability to click on a Quick Launch, or similar link, in their browser window to automatically load a Web Part into the Web Part Zone without having to use FrontPage. To create a Web Part Zone:
-
Choose Web Part Gallery from the drop-down list at the top of the task pane.
-
Scroll down to the bottom of the Web Part Gallery options, until the New Web Part Zone button is visible.
-
Click to position the cursor in a part of the current Web page that is not already part of a Web Part Zone, then click New Web Part Zone.
-
Select a Web Part from the list displayed in the Web Part Gallery Task Pane, then click Insert Selected Web Part to add it to the Web Part Zone you just created.
By default, the Web Part Zone is given a generic name such as Zone 1, Zone 2, and so on. However, you can change the name by right-clicking the zone, and entering a new title in the Zone Title box in Web Part Zone Properties.
EAN: 2147483647
Pages: 179