COMMENTS ABOUT THE DISTRIBUTION
COMMENTS ABOUT THE DISTRIBUTION
The distribution for the t is very similar to the normal curve; that is, it is symmetrical with a mean of zero and a standard deviation slightly more than one. However, the t curve is more peaked than the normal curve. Furthermore, the t is not just one distribution, like the normal curve, but many distributions. Each of these distributions looks different, depending upon its degrees of freedom. Figure 10.1 shows three examples of the t curve with different degrees of freedom. Figure 10.2 shows the t and standard normal distributions.
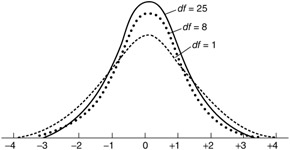
Figure 10.1: t Distributions with 1, 8, and 25 df.
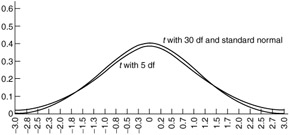
Figure 10.2: The t and standard normal distributions.
Notice that the more degrees of freedom you have, the more your t resembles the normal curve. When the number in your sample is equal to or greater than 100, the normal curve may be substituted for the t distribution. Because the t is composed of so many distributions, tables for the t include these distributions. However, most tables are abbreviated, because you would need a volume to show the different distributions for the t.
EAN: 2147483647
Pages: 252