LOG-LINEAR MODELS
LOG-LINEAR MODELS
Using a cross-classification table and the chi-square statistic, you were able to test whether two variables that have a small number of distinct values are independent. However, what if you wanted to know the effect of additional variables on the relationships that you are examining? You could always make a cross-tabulation table of all of the variables , but this would be very difficult to interpret. You would have hundreds or thousands of cells and most of them would contain few cases, if any.
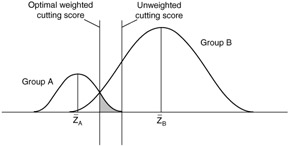
Figure 9.10: Optimal cutting score with unequal sample sizes.
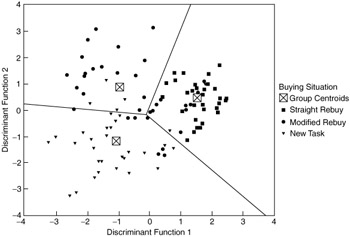
Figure 9.11: Territorial map and rotated discriminant Z scores.
One way to study the relationships among a set of categorical variables is with log-linear models. With a log-linear model you try to predict the number of cases in a cell of a cross-tabulation, based on the values of the individual variables and on their combinations. You see whether certain combinations of values are more likely or less likely to occur than others. This tells you about the relationships among the variables.
EAN: 2147483647
Pages: 252