DISCRIMINANT ANALYSIS
You can use regression analysis to predict values of the dependent variable based on a set of independent variables. The dependent and independent variables are all measured on an interval or ratio scale. What if the dependent variable is not measured on an interval or ratio scale? Instead, your data for the dependent variable are ordinal. What you might want to use in this case is a procedure called discriminant analysis.
In discriminant analysis, you compute "discriminant scores" for each case to predict what group it is in. These scores are obtained by finding linear combinations of the independent variables. (A linear combination is formed by multiplying each variable by some constant and then adding up the products.) For example, you might compute an individual's score by taking 2 times income in thousands, plus 1.5 times age, plus 1.1 times education. Discriminant analysis uses mathematical techniques to determine the way of computing scores that results in the best separation among the groups (in other words, the most accurate prediction of what group each case is in). Statistical packages such as SPSS do all the computations for you, including selection of the best coefficients. The result of a discriminant analysis tells you how well you are able to predict what case a group falls into, based on the values of the independent variables.
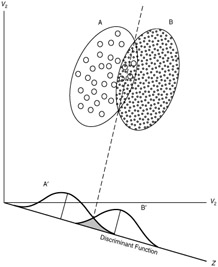
Figure 9.8: Graphical illustration of two-group discriminant analysis.
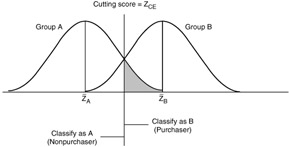
Figure 9.9: Optimal cutting score with equal sample sizes.
Graphical representations of discriminant analysis are shown in Figures 9.8 through 9.12.
EAN: 2147483647
Pages: 252