TOOLS AND TECHNIQUES
Because there are so many tools, it is beyond the scope of this volume to identify and or address each one of them. Rather, we are going to summarize some of the key tools and techniques used in SPC applications.
BRAINSTORMING
Brainstorming is an idea-generating technique that uses the thinking capacity of a group of people. It encourages creative thinking, applying the principle of synergy, that is, that the whole is greater than the sum of its parts .
We use brainstorming in many situations in conjunction with other tools or methodologies or by itself. Some of the uses for which one may use brainstorming within the SPC environment are:
-
To identify quality problems
-
To suggest causes of quality problems
-
To suggest ways to improve process
-
To suggest ways of implementing improvement activities
Obviously, these suggestions imply two categories of usage of this tool: (1) the idea generation process, which is characterized by creative, open , uninhibited, and free association, and (2) idea evaluation, which is judgmental, evaluative, and structured. Another way to think of this is to think of the idea generation as divergent process and the evaluation as convergent process. They are two different processes.
To conduct brainstorming, the group must adhere to the following rules:
-
Do not criticize (by word or gesture) anyone 's ideas.
-
Do not discuss or evaluate any ideas, except possibly for reasons of clarification .
-
Do not hesitate to suggest an idea because you think it sounds "dumb." Many times, these ideas are the ones that lead to the solutions.
-
Only one idea at a time should be suggested by each team member.
-
Do not allow negativism.
-
Do not allow domination by one or two individuals. Everyone must get involved for maximum effectiveness.
-
Do not have a gripe session.
Again it is nice to talk about these items as though they are in a bubble, but the fact of the matter is that we are human beings who sometimes get carried away with emotions and, whether we like it or not, end up creating hard feelings for everyone. To avoid this situation, we recommend the following procedure for idea generation:
-
Select the appropriate individuals for the task under discussion (individuals must have ownership of the problem either directly or indirectly).
-
A good group size for brainstorming is anywhere from 10 to 20 individuals. A larger or smaller group is still workable but usually is not as effective.
-
Set a comfortable ambient environment.
-
Place a large table in the middle of the room and all the chairs for the participants around the table.
-
Send the agenda of discussion to each of the participants at least 24 hours before the meeting.
-
Each person should have a list of ideas of his or her own on a piece of paper before coming into the meeting.
-
Now, while sitting in a circle around the preset table, each person takes a turn reading one idea at a time, starting at the top of his or her personal list. (There is also a variation of this, which is that the participants are not given the agenda ahead of time and will not have had a chance to think or write down a list of issues or concerns. The actual process of brainstorming under this condition begins with the first person who comes up with an idea, and then the rest will follow. We have found that this is a very inefficient way of generating ideas, as well as a time waster . However, it is an option.)
-
As the ideas are read, they should be displayed in such a way that all participants can see them.
-
If a participant's idea has already been read by someone else, he or she should read the next idea on his or her own list, and so on.
-
The leader then asks each person, in turn, whether he or she has thought of any new ideas. It is very likely that in seeing other people's ideas, the group will think of more ideas. This is called piggybacking.
-
The leader continues asking each person, in turn, whether there are any more ideas, until the group does not have any new ideas.
-
The leader provides time for reflection.
The process for idea evaluation is the following:
-
Clarify items identified in the generation phase.
-
Elaborate on the idea ”usually this is done if there are questions about the particular item. The person who offered the idea has priority for discussing it, to elaborate or even clarify it. Others may join in the conversation.
-
Evaluate each idea for both practicality and cost ”it is not expected at this stage that the participants do a full-blown analysis of either feasibility or cost.
-
Edit as appropriate.
CAUSE AND EFFECT DIAGRAMS
These indicate which variables or factors might be important. Once the project objectives have been defined and key problems identified, the next step is to list potential causes of the problem effects to be studied. Usually, this is accomplished in a brainstorming session involving all problem-solving team members . In these sessions, the team leader may find it difficult to proceed through the process of identifying potential causes logically. The team can easily shoot off on tangents and try to solve the problem rather than list potential causes. The leader recognizes the need to keep the team from narrowing their thinking. An open, nonjudgmental discussion must be maintained .
One way to facilitate this discussion is through the use of a cause and effect diagram. This diagram generally takes the form shown in Figure 2.1.
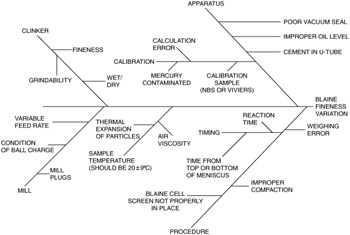
Figure 2.1: Fishbone diagram ”Blaine surface area of good clinker.
The cause and effect diagrams, however, are more than brainstorming tools. These diagrams become "living documents" that are used in all group or team meetings to discuss specific results, sampling plans, testing, and so on. New ideas can be added by any group or team member during a discussion. These cause and effect diagrams, therefore, are outstanding communication devices for all levels of management.
We offer the following method for naming the bones in the fishbone diagram. The basic approach of the cause and effect diagram is to identify the main categories of the process (task). If this seems impossible , a good way to start is with a generic bone for all tasks (problems) and then to modify or regroup the tasks as necessary. The generic formation of all cause and effect diagrams follows the following procedure:
-
To the extreme right, identify the effect.
-
Draw a line toward the effect (at this stage, you should have something that looks like the head of a fish with its spine).
-
Draw the ribs toward the spine and assign them the following categories:
-
People (manpower)
-
Machine
-
Method
-
Material
-
Measurement
-
Mother Nature (environment)
-
From this generic format, one may develop a specific format according to the rules of brainstorming and put the responses in the appropriate category. The following brainstorming technique can help a team formulate a list of potential causes:
-
Review the subject of the brainstorm.
-
Draw the basic fishbone shape on a whiteboard or easel.
-
Give attendees time to individually formulate a list of potential causes (maybe even before the meeting).
-
Go around the group and have each person say one of his or her ideas, continuing this way until everyone's list is complete. It is important that no evaluation takes place here. Allow everyone to freewheel.
-
As new ideas come up, add bones to the fish. Don't take a lot of time trying to decide whether the cause is people, materials, methods , and so on. It its only important that the idea gets up there somewhere.
-
Review the final product, clarifying and combining ideas. Make an attempt to prioritize the causes by having everyone select their top three and tabulating the results. The task now is to support the prioritization with data.
The cause and effect diagram in Figure 2.2 was generated as a result of a brainstorming session; it shows a seal failure example.
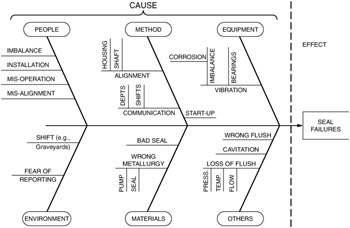
Figure 2.2: Cause and effect diagram ”seal failure example.
AFFINITY DIAGRAMS
As a team brainstorms about potential problems related to a broad mandate from a sponsor, the leader frequently struggles with helping the team reach a consensus about a specific issue on which to focus. To handle this situation, the leader or facilitator passes out to each team member a packet of 3 — 5-in. self- adhesive notes and gives the following instructions:
-
The team leader announces that the team will brainstorm issues relative to the sponsor's mandate.
-
During this session, as one person on the team suggests a specific issue, that person writes it down on a 3 — 5 self-adhesive note and collects these in a pile in front of him.
-
After 30 minutes, all team members post their suggestions on the wall, white board, or easels.
-
Without discussion, each team member, in turn, arranges the adhesive notes in groups or clusters that seem to go together or have some central theme. There will be quiet disagreement as the same adhesive note gets moved around by various team members.
-
After 30 minutes, the specific issues on the adhesive notes will reach a steady state of little or no movement from one cluster to another. Usually, up to seven clusters are formed in this way. Each will be identified as a specific problem.
-
If data can be obtained to identify the major issue among these clusters, proceed with this step. If not, a consensus should be about which issue to tackle first, second, and third. Then work should begin on the first issue, and so on.
Example Quality of Work Life Brainstorming Session
A group of 11 exempt employees met with the company's outside consultants to discuss quality of work life (QWL) in their division. The manager and section heads were not invited to this session. The participants were instructed to begin to brainstorm the characteristics that would best describe QWL. The following list of 28 items (Table 2.1) was generated with contributions from everyone in about 90 minutes.
| Teamwork | Open communication |
| Enjoyment | Open to change |
| See results of work | Listen |
| Feedback (any or none) | Fear of failure/allow mistakes |
| Feelings of respect |
| Genuine interest in you |
| Understanding and empathy |
| Pressure and deadlines | Coaching |
| Adequate resources | Realization of career opportunities |
| Challenge |
| Diversity (assignments) |
| Who is the customer? |
| Prioritization of workload | Cost of living |
| Quality of service (product) | Commute and other outside stress |
| Emergency response and planning | Flexibility |
| Fire fighting and prevention |
|
| Friendly atmosphere |
|
| Atmosphere of trust | Perks (equity) |
Next, each member of the group was asked to review the list and to indicate the five characteristics that needed the most improvement in the division. Selections were made without discussion among group members. Secret ballots were used. All ballots or data were handled to the facilitators for the tally and summary in a Pareto format. However, before doing this, the various characteristics were grouped or clustered using the affinity diagram method. In this format, the results looked like Figure 2.3.
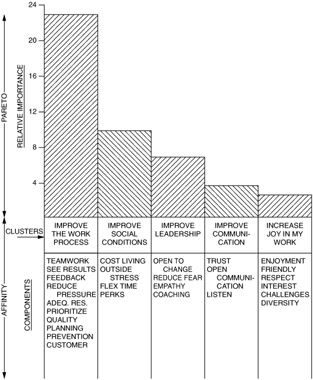
Figure 2.3: Affinity diagram and Pareto chart.
PARETO DIAGRAM
The Pareto diagram indicates which aspects of the problem are most important. The Pareto chart is a method of prioritizing a number of contributory causes of a problem. It is simply a bar chart with the most important item as the first entry on the left, followed to its right by the next most important, and so on. The simplicity of the chart allows one at a glance to separate the vital few from the trivial many. It is an excellent communication tool for teams and for management. In SPC, we use it to identify the priority of problems, given the rule that 80% of the trouble comes from 20% of the problems. It turns out that this generalization holds true for many situations in both manufacturing and nonmanufacturing.
The process of creating a Pareto chart is the following:
-
Determine the number of classifications.
-
Select an appropriate time interval (this has to be representative of the actual operating cycle).
-
Determine the total number of occurrences for each category using primary or secondary data.
-
Compute category percentage.
-
Rank order categories from largest to smallest.
-
Compute the cumulative percentage.
-
Construct Pareto chart for magnitude and cumulative percentage.
| Note | In one process, you may have different shapes of Pareto charts depending on the characterization of the y axis. For example, if you are interested in delays, you are going to have one Pareto shape, but if you chose to track cost, the Pareto chart will show a different priority. Therefore, it is very important when you choose your categories to be sure that you have chosen the ones most appropriate and applicable for your project. |
Example Pareto Chart for a Delay Issue
On a checklist, we have identified the following reasons for the delays in our process:
| Reason | Frequency Count for Reason |
|---|---|
| No schematics available | 10 |
| Test equipment down | 21 |
| Inadequate parts | 37 |
| Lack of available personnel | 3 |
| Waiting for engineering decision | 5 |
| Delay in inspection | 14 |
| Total delays | 90 |
Once we have the delays identified, we do some reorganization of the data (see Table 2.2). Now that all the calculations are made, we are ready to draw the Pareto chart (see Figure 2.4).
| Reason for Delay | Frequency | Percentage of Total Delays | Cumulative Percentage |
|---|---|---|---|
| Inadequate parts | 37 | [37/90] — 100 = 41.10 | 41.10 |
| Test equipment down | 21 | [21/90] — 100 = 23.33 | 41.10 + 23.33 = 64.43 |
| Delay in inspection | 14 | [14/90] — 100 = 15.55 | 64.43 + 15.55 = 79.98 |
| No schematics available | 10 | [10/90] — 100 = 11.11 | 79.98 + 11.11 = 91.09 |
| Waiting for engineering decision | 5 |
| 91.09 + 5.55 = 96.64 |
| Lack of available personnel | 3 |
| 96.64 + 3.33 = 100 |
| Total | 90 | 100% | 100% |
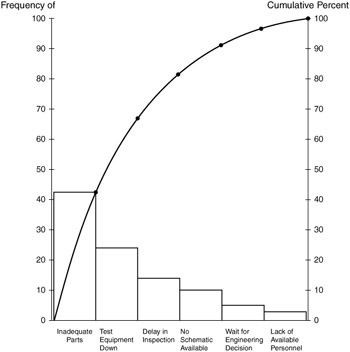
Figure 2.4: Pareto chart for delays.
WORK FLOW ANALYSIS (PROCESS MAPPING OR PROCESS FLOW DIAGRAM)
Work flow analysis is a structured system to improve or to understand a work process. One of the major advantages of constructing a work flow analysis (WFA) diagram is that one can identify and remove no-value-added activities to streamline the work flow into an effective and efficient operation (see Figure 2.5).
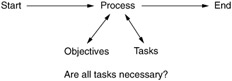
Figure 2.5: Work flow analysis overview.
There is almost always a better, easier way to do something. WFA identifies and eliminates unnecessary process steps by analyzing functions, activities, and tasks; it uses cross-functional teams.
We construct a WFA chart by using the following steps:
-
Define process in terms of purpose, objectives, and start and end points
-
Identify functions ”major responsibilities of organization, including manpower and planning
-
Identify activities ”below functions, usually reside in a single department
-
Identify tasks ”basic steps used to perform each activity and to provide the most specific description of a process
-
Analyze the process with a cross-functional team
-
Identify lengthy tasks, chock point (hard points), duplicative tasks, no- added-value activities (i.e., inspection, flow, storage, and so on)
-
Determine and implement an action plan for improvement
An example of a work flow analysis chart is shown in Figure 2.6. In this example, we also have identified specific tools that may be used in specific areas of the flow.
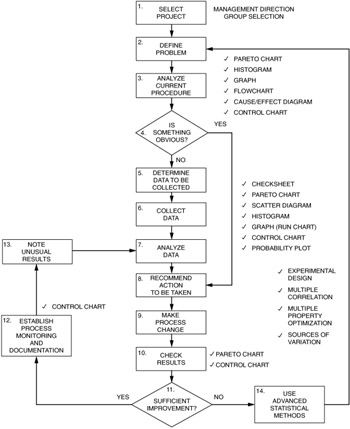
Figure 2.6: Process flow diagram for a quality improvement project (with specific tools associated with specific tasks).
In the classical sense of constructing a flow of a process, we use - as a general rule - five chart symbols, which are shown in Table 2.3.
| Symbol | Name | Activities Represented |
|---|---|---|
| O | Operation | Work being done ( assembled or disassembled); value-added task |
| ’ | Transportation | Movement from place to place |
| q | Inspection and checking | Observing and measuring |
| D | Delay | Waiting its turn |
| V | Storage | Cannot be moved without permission |
INPUT-OUTPUT ANALYSIS
This is a systematic method for identifying interdependency problems by defining objectives and listing inputs and outputs for major tasks, functions, or individuals. We may want to do this analysis to clarify roles and responsibilities, resolve conflicts, eliminate duplications, and open the lines of communication. A schematics overview of this analysis is shown in Figure 2.7.
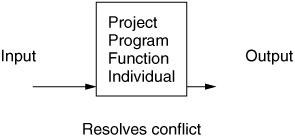
Figure 2.7: Input-output analysis overview.
In addition, the input-output analysis will help us to:
-
Define program objectives or deliverables, work breakdown structure, master schedule, and actual process.
-
Define prime and support responsibilities.
-
Define each team member's role.
-
Use nominal group technique for improvement ideas.
NOMINAL GROUP TECHNIQUE
The nominal group technique (NGT) is similar to brainstorming. It is a very structured approach to generate ideas and survey the opinions of a small group (10 to 15 people). NGT produces many ideas or solutions in a short time. It is structured to focus on problems, not people; to open lines of communication; to ensure participation; and to tolerate conflicting ideas. The NGT builds consensus and commitment to the final result.
The procedure for conducting NGT is as follows:
-
Present the issue and instructions.
-
Generate ideas (5 to 10 minutes of quiet time with no discussion).
-
Gather ideas round- robin , one idea at a time; write them on a flip chart and post them.
-
Process and clarify ideas ”duplicates are eliminated; like ideas are combined. Limit discussion to brief explanations of logic or analysis of an item and brief statements of agreement or disagreement. Focus on clarification of meaning, not arguing points.
-
Set priorities silently.
-
Tabulate votes .
-
Develop an action plan.
QUALITY FUNCTION DEPLOYMENT
Quality function deployment (QFD) is a conceptual map that provides the means for cross-functional planning and communication. It is a method for transforming customer wants and needs, through the help of the Kano model, into quantitative engineering terms.
QFD is conducted because products and services should be designed to meet customer wants and needs so that customers will buy and continue to buy products and services. Marketing people, design engineers, manufacturing engineers , and procurement specialists work closely together from the time that a product or service is first conceived to be able to meet customer requirements. QFD provides the framework for the cross-functional teams to work within.
A typical approach to a QFD methodology is illustrated by the following questions (more about this in Volume VI):
-
What do customers want (attributes)?
-
Are all preferences equally important?
-
Will delivering perceived needs yield a competitive advantage?
-
What are the engineering characteristics that match customer's attributes?
-
How does each engineering characteristic affect each customer attribute?
-
How does one engineering change affect other characteristics?
COST OF QUALITY
Cost of quality (COQ) is a system providing managers with cost details often hidden from them. It consists of all the costs associated with maintaining acceptable quality, plus the costs incurred as a result of failure to achieve this quality. In essence, COQ is done to identify the cost of not doing things right the first time. This cost, more often than not, is quite considerable and, in some cases, totally ignored because of ignorance of the system. This, by the way, is also true for administrative costs.
The process for establishing a COQ program is as follows:
-
Identify all quality costs. These include costs of nonconformance and costs of conformance (see Table 2.4).
Table 2.4: Cost of Quality Before COQ
After COQ
Conformance
Prevention
Appraisal
Nonconformance
Internal failures
Prevention
Conformance
Appraisal
Internal failures
Nonconformance
External failures
External failures
-
Identify the most significant costs
-
Identify the causes of these major costs
-
Identify solutions to reduce or eliminate causes
-
Implement solutions
PRODUCT NONCONFORMANCE REDUCTION
One may argue whether product nonconformance reduction is a tool, policy, or methodology. We are not going to resolve the issue here. However, we are all (quality professionals and management) supposed to be aware of this issue because this is a prevalent way of "fixing" problems. Although we wonder how many of us really believe this process, the fact of the matter is that we all accept it in our everyday work environment. It is puzzling that its acceptance is so universal, even though we know that this process's effectiveness is only 79%.
We seem comfortable with this because we have targets, we have experienced personnel doing the conformance-nonconformance routine, and ultimately we have penalties and rewards for those who do not perform to our expectations. How sad indeed.
We are talking about inspection and the identification of critical inspection points. Inspection is indeed checking (an appraisal system ”an after-the-fact task) to see that an item meets the specification set for it. Specifications are the engineering requirements. In other words, if it meets the specifications, it is as it was designed to be. On the other hand, a unit that does not meet the specifications is called a defective or nonconforming unit. Sometimes, only one small thing is wrong with the unit. When this happens, it is called a defect or nonconformity.
Inspections are used to do the following:
-
Check incoming material for quality.
-
Check finished product.
-
Help to back up process control.
-
Tell when to stop a mistake from happening.
-
Tell when to correct a mistake.
Certainly checking is important. But it must be done in a manner that is scientific and representative of the whole. If checking is done only at the end of production, for example, there is no way to tell what went wrong, because there is no way to tell when it went wrong. And this, of course, is costly. It saves time and money to plan inspections from the beginning of the manufacturing process. This is where the flow chart comes in.
There are two types of inspections:
-
Variable ”in which a measurement is taken. The following are examples:
-
How long is it?
-
How wide is it?
-
What does it weigh?
-
-
Attribute ”in which things cannot be measured. They are looked at, such as with the following questions:
-
Is it right side up?
-
Are there dents or scratches?
-
Is the name or emblem on the product?
-
All inspections are conducted during one of three stages in production:
-
Incoming
-
In process
-
Finished goods
The characteristics of these stages are summarized in Table 2.5.
| Inspection | Specific Instance(s) | Description |
|---|---|---|
| Purchased material | At delivery | Materials must match order and be in good shape |
| Purchased material | At start of production line | Check for damage during storage |
| In-process inspection | Before a costly operation | A problem caught here saves time and money |
| In-process inspection | Before it becomes unfixable | At the point where the part is thrown out, kept, or fixed |
| In-process inspection | Before it becomes unfixable | No coating or painting to hide a defect |
| Finished goods and inspection | Before packaging | Only after last operation; if inspection was held off until now, machine and labor time have been wasted |
TIME MANAGEMENT
Managing time to gain flexibility and control of activities is an important aspect of continual improvement and SPC.
All of us are busy with our everyday tasks. To implement continual improvement, all of us have to chip in, timewise; otherwise , we will not be successful. Because SPC and continual improvement are people issues and are implemented and maintained by people who usually have their own tasks, it is imperative to recognize that time management is of concern. By using the discipline of time management (project management will be discussed in Volume VI), discretionary time can be increased and applied to improvement efforts.
How do we do this? By prioritizing the activities. Use a simple system that can be used by anyone. We suggest the ABC approach:
-
A activities are must do.
-
B activities are beneficial but not mandatory.
-
C activities are unnecessary and are time wasters .
A second task that one may do for effective time management is to identify and remove time wasters such as the ones in Table 2.6.
| Unclear objectives | Low morale |
| Postponed decisions | Inconsistent actions |
| Lack of information | Poor physical fitness |
| Interruptions | Shortage of managerial tools |
| Lack of self-discipline | Absence of procedure for routine matters |
| Lack of priorities | Failure to delegate |
| Junk mail ( pagers , e-mail, and so on) | Visitors |
| Unnecessary meetings | Telephone |
| Crisis management | Lack of feedback |
| Red tape | Procrastination |
| Inability to say no | Poor information |
| Mistakes |
ACTIVITY STREAMLINING
Activity streamlining results in a set of activities to eliminate unnecessary or conflicting requirements that compound cost and time without adding capability and value to the organization's acquisitions. It is a way for producers (suppliers) to help the customer (specific organization) define requirements and reduce cost. The focus of this technique is specifying "true" customer requirements and stating what they are, as opposed to the definition of how to do it.
The streamlining activity is an important technique for promoting innovative and cost-effective acquisition strategies and requirements that will result in the most efficient use of resources for production of quality products and services. In addition, activity streamlining can reduce the cost or time of system acquisition and life cycle cost without degrading the system. This technique may work in tandem with just-in-time inventory techniques, project management, and SPC.
To undertake the streamlining, the following generic process should be followed:
-
Specify requirements in terms of results desired, not "how to design" or "how to manage." Here, the use of the Kano model or QFD may be helpful.
-
Preclude premature application of design solutions and specifications.
-
Tailor requirements to unique circumstances of individual programs.
-
Limit the contractual applicability of referenced documents.
In conjunction with this technique, the organization must be tuned to the transition from development to operations directive, which requires the application of integrated design and engineering disciplines in the construction and conduct of organizational acquisition programs (concurrent engineering). Use of a formal risk reduction program is also prescribed, for which a guidance manual containing policies, directives, or templates to follow (these are specific to the organization) is provided. If templates are used, they should have been designed based on experience and a focus on success of the system. The transition manual becomes the roadmap of acquisitions and is treated as a process. Therefore, it is a document ”at least in concept ”for continual improvement and should, if applicable and appropriate, be used whenever possible.
Why should you consider this transition activity? Because cost, schedule, and performance problems in acquisition manifest themselves as failure to make a smooth transition from development to production and initial deployment. Failure is most frequently a consequence of treating transition as a managerial event rather than a technical process. A successful process considers all life cycle disciplines, including producibility and supportability, from the outset and establishes a continuum of integrated design, test, production, and support.
How do we do this? The easiest way is to develop templates (checklists of sorts). These may be used to identify the most frequently encountered risks and to describe the attributes and characteristics of a low-risk program. Risk is reduced and improvement is made when the process is changed. (Remember that an improvement in the process is a change.) Each template includes a timeline suggesting when the activity might best begin and be completed. The end result is to have a process defined with critical milestones and deliverables at each milestone. (A good model to follow on this is the automotive version, which is called advanced product quality planning .)
COULD COST
Could cost is an approach aimed at substantial quality improvement and cost reductions in developing and producing products and services through elimination of unnecessary procurement regulations. It is also known as supply chain management.
Could cost is a way to get suppliers and customers to work together to eliminate no-value-added effort. Could cost is a new way of doing business, but most changes require no new policy directives or new contracts. The one restriction is that all requirements, rules, contracts, and conventions of doing business are subject to critical examination and challenge.
To undertake the could-cost approach, the following steps are necessary:
-
Develop could-cost proposal for changes to request for proposal.
-
Coordinate the efforts with key suppliers.
-
Evaluate (data-driven) proposal in source selection.
-
Negotiate changes after contract award.
-
Reduce contract price by negotiating cost reduction for changes.
-
Execute agreements with key subcontractors .
VALUE ENGINEERING
Value engineering is a systematic functional analysis leading to actions or recommendations to improve the value of systems, equipment, facilities, services, and suppliers. Value is defined as the best balance between performance and cost. The term value engineering (VE) is used synonymously with value analysis, value control, value improvement, and value management.
If the interest is to simultaneously improve quality, reduce cost, and improve schedules, then VE is the tool of choice. VE, then, for all intents and purposes, is an optimization model with constraints of cost, schedule, and quality.
To conduct a value-engineering study, the following are necessary:
-
Identify required functions
-
Analyze current solution by breaking into primary parts, which address required functions, and secondary parts, which support primary parts
-
Identify cost associated with each part
-
Identify cost to perform required functions
-
Minimize secondary parts
-
Develop alternative solutions with associated costs that meet required functions
-
Select and implement solution that provides the best value
RELIABILITY AND MAINTAINABILITY
This is perhaps one of the most underused problem-prevention and problem-solving methodologies within the cycle of continual improvement. A detailed discussion will be covered in Volume VI; see also Chapter 16 of this volume on machine acceptance. The reliability and maintainability (R&M) initiative is a formal methodology emphasizing ”initially ”basic SPC and then progressing to variation reduction, design of experiments, and QFD. The ultimate function of R&M is to deliver a robust design to the customer and desensitize manufacturing variation in noise.
R&M is essential ” especially to manufacturing ”because, by design, it improves the reliability and maintainability of its systems to increase machine capability and availability. It does this by using tools such as:
-
SPC
-
Concepts of variation
-
Design of experiments
-
QFD
-
Concurrent engineering and robust design principles
-
Mistake-proofing principles
THE FIVE WHYS
The five whys is perhaps one of the easiest tools in the tool chest of anyone who wants to solve problems. When one wants to resolve a question, a problem, a concern, a disagreement, or the underlying cause, obviously one asks questions about it. The five whys is a methodology of asking these five questions in a sequence to get to the heart of the problem. It is no more difficult to ask multiple "whys" than to ask the first "why." An example may prove the point.
What is the problem? "Deliveries are not completed by 2:00 p.m." Why does this happen? "The routing of trucks is not optimized." Why ? "Goods are loaded in the trucks based on size rather than location of delivery." Why ? "The computer automatically defines the order based on large items first." Why ? "Large items are delivered first." Why ? Current workflow prioritization puts large items first on the delivery schedule, regardless of location and proximity.
The process stops when there is no answer to a "why." The last response becomes the root cause of the problem. See Figure 2.8.
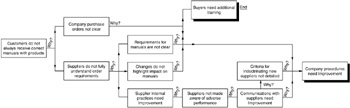
Figure 2.8: Flowchart of five-why sequence.
FORCE FIELD ANALYSIS
Force field analysis (FFA) is a systematic way of identifying and portraying the forces (quite often people) for or against change in an organization. The specific forces will be different depending on the area in which they are applied.
Why are we talking about forces? Because one of the essential foundations of FFA is the system approach. If we accept the concept that a system will seek to maintain stability by countering initiatives for change, it becomes clear that if we are to engineer change, we need to consider not just the presenting problem but also the forces and relationships that exist within the system. We are each part of a system, the team that we work with is part of a larger system, and so on. We need to step outside the system if we are to see what is really happening, to identify the patterns and belief systems that drive behavior. We need to move to a meta-level of analysis.
From this position, we can view the system as a whole, or systemically; we can identify the forces that are at work and change the relationships between them. This means working on them simultaneously by increasing certain key driving forces while also reducing the restraining forces.
Typical steps in conducting FFA are as follows:
-
Identify the actual driving forces or factors working for change (define the current situation).
-
Prioritize driving forces by voting or use of some consensus-achieving technique (define or base the desired position on the results of an FFA).
-
Identify current restraining forces or factors working against change (define the worst possible situation).
-
Prioritize restraining forces (What are the forces for change? What is their relative strength?).
-
Identify potential driving forces or factors that realistically favor change but that are not yet currently operating (What are the forces against change? What is their relative strength?).
-
Identify potential restraining forces or realistically possible forces that would work against change if they were present (What forces can you influence?).
-
Determine whether there are actions that can be taken to do the following:
-
Increase the effect of the current driving forces
-
Add to the driving forces or cause potential driving forces to happen
-
Decrease or eliminate the current restraining forces
-
Ensure that the potential restraining forces do not occur or do not affect the issue being investigated
-
Eliminate specific action that can be taken relative to each of these forces that cannot be influenced
-
-
Begin to develop some strategy statements about proposed actions. Statements should begin to answer who, what, when, where, how, how much, and what are the expected results.
BENCHMARKING
Benchmarking is a structured approach for learning from others (the best) and applying that knowledge in our own process. Benchmarking, contrary to common belief, is not an end in itself. Rather, it is a continuous learning process for understanding and measuring our own operations, comparing them with other organizations (in or out of our own industry) that are recognized as having the "best" practices, and implementing plans to adapt and change our operations to meet and surpass those practices. The essential elements for benchmarking are summarized in Table 2.7.
| Leadership | Build leadership team commitment Commission the benchmarking team |
| Plan | Identify critical performance measures Identify comparative operations Measure your own performance |
| Analyze | Determine data collection method and collect data Analyze and compare data to determine gaps |
| Implement | Communicate findings and recommendation Develop plans to meet and surpass "best" operations |
| Nurture | Implement plans and monitor progress Review competitive position |
How do these essential elements translate into action? The progression to a successful benchmarking is shown in Table 2.8.
| Emphasize Leadership Role | Identify Key Processes | Internal Benchmarking | Worldwide Benchmarking | Pitfalls to Avoid |
|---|---|---|---|---|
| Focusing on doing things differently | Own | Similar processes | External network | Benchmarking effort too broad |
| Linking benchmarking with business strategy | Influence | Worldwide | Identify partners Build relationships | The management is not committed to change Visit another company before you are ready Fail to implement plans Incorrect focus on the metric |
| Leadership | Determining what to improve Implementing new ideas | |||
| Knowledge of own processes | Key process identified Key process owners identified Process flow is charted, documented, and understood | |||
| Existence of performance measures | Key processes and key measurables exist and are monitored Key measures are defined Key measures ”method of collecting data is defined Customer satisfaction process exists | |||
| Quality improvement process prioritization | Improvement needs are prioritized Enhancement needs are prioritized | |||
Although it is nice to know the progression to success, it is even nicer to have a direction and a model for that success. After all, in this chapter, we are concerned with tools and techniques for problem solving. So what is the connection? Ultimately, we want to solve the problem of variation ”waste ”and as a result, we want to improve our operations and the financial performance. To do that, we must recognize that one issue is internal ”process improvement ”and that the second issue is external ” customer satisfaction. Because both issues are important, we must understand the flow of the ultimate success, which is customer satisfaction. This is shown as follows:
customer focus continuous improvement goal setting philosophy how do we compare? how do we create a competitive advantage?
The last two questions in that sequence, of course, can only be answered by management, and they are the driving force for answering the four key questions:
-
Who is the best at what you do?
-
How do you know?
-
What accounts for the gap?
-
What are you going to do about it?
In Figure 2.9, we show a more detailed model for a strategy of operational excellence and financial performance.
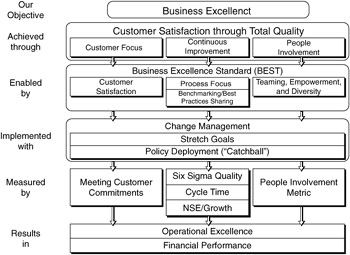
Figure 2.9: A strategy for operational excellence and financial performance.
The steps for implementing benchmarking are as follows:
-
Establish management support champion
-
Define the process
-
Demonstrate and advertise early successes
-
Promote comparisons and quick learning as a cultural norm
-
Develop internal network of motivated practitioners
-
Develop and maintain knowledge repository
-
Work on high-profile priorities
-
Continue to advertise success
EAN: 2147483647
Pages: 181