INFORMATION PHASE
DEFINE THE PROBLEM
The first phase of the job plan is the information phase. It is broken down into three distinctly separate parts :
-
Information development
-
Function determination
-
Function analysis and evaluation
They are all part of the information phase because in reality, they are part of the problem resolution. The work done in the information phase is the basis for the development of alternative methods to perform the required functions. If the functions have not been properly defined and evaluated, the correct questions will not be generated, and the most satisfactory problem solution is not likely to be developed.
Information Development
Information Collection
The first part of the information phase is the development of all available information concerning the project. This includes drawings, process sheets, flow diagrams, procedures, parts samples, costs, and any other available material. Discuss the project with people who are in a position to provide reliable information. Check to be certain that honest wrong impressions are not being collected, that is, information that may have been fact at one time but is no longer valid.
It is very important that good human relations be used during this data and information collecting phase. Get the person responsible for the project or development in the first place to help by showing that individual how he or she will be able to profit from successful results of the completed study.
The project identification pre-workshop checklist ” Table 12.1 ” details all of the information required for study. If the data or information are not on hand, it will be necessary to obtain them. A basic information data sheet that should be filled out as a first step to identify the project is shown in Figure 12.2. A brief description of the project should be written under "Operation and performance" to be certain all of the team members are in at least basic agreement as to the product or process operation. If available, a schematic or a picture should also be drawn in this area.
|
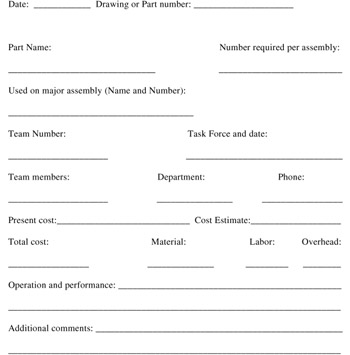
Figure 12.2: Project identification sheet.
Cost Visibility
The next step towards a problem solution is to complete the cost visibility section ” Figure 12.3 ” of the cost-function worksheet as detailed in the cost visibility sheet ” Figure 12.4.
| Cost Visibility | Team No: | Assembly Part Name: | ||||||
|---|---|---|---|---|---|---|---|---|
| Sheet | Date: | Assembly Part No: | ||||||
| Determine Manufacturing | Determine Cost Elements | |||||||
| Cost | ||||||||
| Material $ | Labor $ | Burden $ | ||||||
| Item # | Reg. | Part Name | Raw Material $ | Labor $ | Burden | Other | Total Component | Cost per unit |
| Total cost | ||||||||
Figure 12.3: Cost visibility sheet.
| List all functions and separate from constraint | Basic | Second | Remarks | |
|---|---|---|---|---|
| Verb | Noun | |||
Figure 12.4: Cost function worksheet.
P.F. costs are estimated as follows :
| Manufacturing cost | = | Material + Labor + Burden |
| P.F. cost or Total cost | = | Manufacturing cost + Other |
Review these cost data in accordance with the preset goals of your project, and make a preliminary judgment of the potential profit improvement. Consider the factors involved and set a goal for achievement that will provide a profitable position. The target should indicate a 30 to 100% cost reduction to be practical. It may seem improbable that this can be achieved; however, it is a target to work toward. A check against this target will be made at the completion of the information phase.
Project Scope
It is now possible to make a preliminary determination of the project scope. Consider the new project as outlined on the project identification sheet, the present cost and target for improvement, and the time available for the study. After evaluating these factors, define the scope. Limiting or expanding the scope of a study depends on the objective and the time allowed for the study. In project work, the analysis of function should first be performed upon the total assembly or process. If the objectives of the value control study are not achieved at that level, the next lower level should be studied and so on down to the lowest level of indenture. The lower the level of indenture, the more detailed and complex the study will become. This may require additional time in the present study or future studies to consider segments identified by function analysis.
For existing projects seeking to improve performance or utility in general, there are usually existing designs that have cost data available. This will mean that thinking can be focused on a chosen part of a complex assembly. Everything up to and beyond the basic part should be accepted as necessary. Therefore, the initial scope will have been defined. However, as the study progresses, it may be necessary to redefine the scope to ensure completion of the project within the available time and conditions of the workshop.
Function Determination
The information on hand together with an analysis of costs will tend to define the initial scope of the project. The product or process has been defined and its cost evaluated by use of the cost visibility techniques and a target set. It is now possible to start to define the functions to be performed or that are being performed by the system.
Start with the function or functions of the assembly or total system, then break the system down into each part and define the functions of each. Remember to strive to define the functions in two words, and also keep in mind that the definition must not constrain thinking. It is the function definition that will help to visualize new ways to satisfy the function. If it is too constraining, it will tend to restrain thinking.
Figure 12.4 should be used for this effort. Most simple products will have at least 20 “25 functions. Detailed information on defining functions is covered further on in this section.
Function Analysis and Evaluation
After the functions have been determined, identify the basic function or functions. The basic function is the function that cannot be eliminated unless the product can be eliminated. There may be more than one, but an effort should be made to determine the one most likely basic function. Determining the basic function is the first step in the construction of a FAST diagram. A detailed discussion on the construction of FAST diagrams is to be found further on in this section.
The FAST diagram makes it possible to complete the cost function worksheet. A typical cost function sheet lists all functions versus all parts of a product or actions of a system, procedure, or administrative activity. The objective is to convert product cost to function cost.
The cost of each piece of hardware or action is redistributed to the function performed. This proportional redistribution of cost to function requires information, experience, and judgment, and all team members must contribute their expertise.
After the cost of each part or action has been redistributed to the functions performed, the cost columns are totaled to obtain the function cost. This cost is then placed on the FAST diagram. The FAST diagram then becomes a very valuable tool. It tells what is happening, why, how, when, and what it costs to perform the function. It is now possible to evaluate the functions to determine if they are worth what is being paid for them. In other words, a value must be set on each function.
Determining the value of each function is a subjective process. However, it is a key element in the value process. Comparing the function cost to function value provides an immediate indication of the benefit being obtained for expended funds. The ratio of value cost to function cost is the performance index. The sum of all values is the value of the system or the lowest cost to reliably provide the basic function. It should be compared to the preliminary goal set earlier.
It may be that the new goal is considerably higher than the original. If this is the case, an evaluation of the diagram will indicate what must be done to achieve the original goal. It may indicate that an entirely new concept is required, or it may be that it will be acceptable to settle for less. It is often the case that the original goal and the new value are close. An analysis of the function costs will again indicate necessary action.
This analysis clearly defines the task for product improvement. It breaks the problem down to functions that must be improved, revised, or eliminated to achieve the goal. It is now possible to proceed to the second phase of the job plan ” the creative phase.
COST VISIBILITY
Experience has shown, for example, that the automotive industry is a price leadership industry. Experience has also shown that in spite of the tremendous leverage of the industry, it cannot control the prices it must pay for the basic materials required for production. It is then quite clear that we cannot buy materials for less and we cannot sell our products for more. Consequently, only one avenue remains open to increase profit, and this is to identify the areas of high and unnecessary costs and to find ways to reduce or eliminate these costs.
In the past, tremendous effort has been made to keep our products at a competitive level. The intent is to add value control as another tool to aid in achieving the desired function of a product at the best cost.
Cost visibility techniques are the first to be applied in the value control job plan. Cost visibility techniques are well ordered and range from very simple to highly complex. These techniques do not tell us where unnecessary costs are; they tell us where high costs are. This is important because they identify a starting point.
Definitions
Since the techniques of cost visibility are concerned with all types of costs, each type will be defined so there is no misunderstanding:
-
Actual cost ” Costs actually incurred during the performance of a manufacturing process. They include labor, material, and burden applied in accordance with local ground rules.
-
Allowance ” Costs other than material, labor, and burden that must be included in the total cost of a product, such as: packaging materials, scrap, inventory losses, inventory costs, etc.
-
Burden ” Includes all cost incurred by the company that cannot be traced directly to specific products. The accounting department determines burden rates. These are assigned to individual operations on a formula basis. Burden consists of both fixed and variable categories, and separate rates are often established for each. The method of assigning burden differs from industry to industry and even from one company to another within an industry. Any quantifiable product factor may serve as a basis for assignment of burden as long as consistent use of the factor across the entire product line results in full and equitable burden distribution.
-
Fixed burden ” Includes all continuing costs regardless of the production volume for a given item, such as salaries, building rent, real estate taxes, and insurance.
-
Variable burden ” Includes costs that increase or decrease as the volume rises or falls . Indirect materials, indirect labor, electricity used to operate equipment, water, and certain perishable tooling are also included in this classification.
-
-
Cost ” The amount of money, time, labor, etc. required to obtain anything. In business, the cost of making or producing a product or providing a service.
-
Design cost ” The sum of material, labor, and variable burden. An understanding of the elements of design is essential for an understanding of cost visibility techniques.
-
Fixed cost ” Cost elements that do not vary with the level of activity (insurance, taxes, plant, and depreciation).
-
Incremental cost (sometimes called a marginal cost) ” Not all variable costs vary in direct proportion to the change in the level of activity. Some costs remain the same over a given number of production units, but rise sharply to new plateaus at certain incremental changes. The costs thus effected are incremental or marginal costs.
-
Labor ” Manpower expended in producing a product or performing a service. Labor may be direct or indirect.
-
Direct labor ” Labor that can be traced directly to a specific part. Wages paid the stamping press operator would be classified direct labor.
-
Indirect labor ” Labor that is necessary in the manufacturing process but is not directly traceable to a specific part (material handling, inspection, receiving, shipping, etc.) is generally included in burden.
-
-
Manufacturing cost ” The sum of material, labor, and variable burden. An understanding of the elements of manufacturing is essential for an understanding of cost visibility techniques.
-
Material ” All hardware, raw ( steel , zinc, plastic powders) and purchased (instrument panel knobs , decals, rivets, screws , etc.) items consumed in manufacturing a part. Material may be direct or indirect.
-
Direct material ” Raw and purchased material which becomes an integral part of an end item. (The cost of the metal from which a fender is formed would always be a direct material.)
-
Indirect material ” Material that is necessary in the manufacturing process but is not directly traceable to a specific part (lubricants, wiping cloths, marking pens, etc.) is generally included in burden.
-
-
Profit ” Amount earned in producing a part or a service. It is usually applied as a percentage of manufacturing cost.
-
Standard cost ” A theoretical manufacturing cost developed by engineers and accountants . It is based on manufacturing processes, work measurements, and material sizes and weights developed by engineers and historical and current actual costs furnished by accountants. Standard costs are used to measure the amount of materials, labor, and overhead factors that enter into the manufacture of a product. Dollar values are assigned to these theoretical costs as a common denominator. Standard costs are important as control aids ” although they are based primarily on historical data.
-
Total cost ” Includes manufacturing cost plus a profit and other expenses. The following expenses are usually added to manufacturing cost by sales and/or accounting departments to make up the total cost:
-
Administrative and Commercial Costs ” Costs incurred in the administration of the company, research, and selling of the product. They are usually a factor represented as a percentage of manufacturing cost.
-
Freight Costs ” Costs incurred in getting materials, sub-assemblies and purchased parts to manufacturing or assembly plants.
-
Sources of Cost Information
The application of cost visibility techniques begins with an analysis of total cost, progresses through an analysis of cost elements, and finally analyzes component or process costs. To perform these steps the best cost information available is required. This information will be available from sources such as:
-
Accounting ” Current and historical costs (actual costs)
-
Purchasing ” Cost of purchased items and tools, tool breakdowns, operation line-ups, and material weights, both gross and net
-
Operating facilities cost planning ” Estimated costs of parts and tools, process sheets and material weights.
-
Suppliers ” Estimates and/or quotations, costs, process information, and material prices.
-
Feasibility and value guidance ” Manufacturing feasibility and cost trends. All requests to previously mentioned sources should be channeled through an appropriate Value Guidance Group to coordinate and follow.
Cost Visibility Techniques
These techniques are not necessarily used in chronological order. We must always use our judgment, not only in utilizing the techniques that indicate high cost, but also in utilizing all the other tools of value control.
Cost visibility analysis is based on the information shown in Figure 12.3. Based on the information gathered, the team makes the appropriate recommendations.
Technique 1: Determine Manufacturing Cost
First look at manufacturing costs and, basing your judgment on experience or comparison, determine if the part is worth the cost. This technique is simple and obvious ” but perhaps it has been overlooked as an indicator as to where high costs may be. If this technique tells us that the cost is high, it is necessary to go to one or more of the other techniques to find out specifically where that high cost is located.
Technique 2: Determine Cost Element
If the objective is to locate the high cost, use the second technique which involves determining cost elements. Here, the total direct material, total direct labor, and total burden are broken out of the total manufacturing cost. The elements of total cost again offer a basis for comparison:
Determine Cost Elements
Material $_________ Labor $_________ Burden $______
Compare material content with labor dollar content. Compare these elements of cost with those for another similar manufactured item. If the elements of cost vary, it is an indication one may be high in cost, and the reason for the difference must be found.
This technique can also be used to arrive at a normal distribution of cost. Accounting can usually determine the normal distribution of cost in material, labor, and overhead for a specific department or profit center. Every part can then be compared to the distribution cost to determine if the cost elements are high or low. Again, comparison is being used to find high cost.
The cost breakdown may show that $10 worth of material and $.10 worth of labor are being expended on a certain part. If this is the case, it can be asked if we are in business to spend $.10 on labor for $10 worth of material. Perhaps the material supplier should be asked to perform the labor operation. This could eliminate the labor which may be used more productively elsewhere.
Conversely, it may be found that $.10 worth of raw material requires $10 worth of labor. If this is the case, the overhead should be broken down into variances, setups, tooling, direct labor, indirect labor, etc. The manufacturing area should be questioned about methods and processes, profit centers being used, overhead, capital equipment, labor grades, etc.
Technique 3: Determine Component or Process Costs
The third technique goes one step further in breaking down material, labor, and overhead. To determine component and element costs as they occur in the manufacture of a part, break down each component as shown in Figure 12.3.
Figure 12.3 shows the components broken down in elements. From this list, you examine the reasonable costs versus the unreasonable. The process may sound very subjective at this stage, but it is important to differentiate an item that does not "fit" the pattern of other items. When the examination ends, more than likely you have identified a "most probable" high cost item. Circle this amount, and examine it in detail. Determine why this cost is so far out of line with other operations. This technique gives a very precise and accurate cost visualization. It shows where costs are being created on a component and element basis. Almost every analysis would include the use of techniques 1, 2, and 3.
Now think of the third technique in more depth. If we study technique 3 in depth, we will see that it can be used to analyze parts being assembled into a major sub-assembly, major sub-assemblies being put together into a final assembly, and a number of final assemblies being put together to make the total product. Good judgment must be used in the application of this technique, and it will also dictate the way the techniques should be used.
Technique 4: Determine Quantitative Costs
This technique analyzes cost on the basis of some measurable unit such as time, weight, size , area, etc., and then makes a comparison with the cost per unit of a known good value. It is sometimes surprising how seemingly complex products will fall into a pattern.
One of the most convenient ways to use this technique is to build a cost curve for the product under study. A comparison to the curve will indicate whether the product is high or low. Techniques 1, 2, and 3 can then be used to zero in on the specific cause of the cost deviations.
Cost per period of time ” This is good for high volume production. It can also be used to describe cost per similar product class. Simply determine the number produced in a convenient time period, minute, hour , day, etc. This can then be compared to a similar unit. A simple example would be the cost per unit of a specific class and size fastener.
Cost per pound ” This is a basis for comparison usually applied to castings, weldments, or forgings, but it can be applied to anything that will plot on a graph. Determine the cost per pound of each item and plot these on a graph, and the high cost items will be immediately apparent. Again, this is a basis for comparison ” another way to find meaningful cost basis. Remember, even though weight may not be an important design criterion, it still costs money to ship every pound of unnecessary weight.
Cost per dimension ” Some examples of the use of this unit would be as follows: the cost per unit length for a simple extrusion , the cost per unit volume in a tank, the cost per unit length of wiring, The cost per square foot of area covered by a high-cost epoxy paint. These are convenient cost figures to have available as a basis for comparison. Cost per unit of length, area, and volume are the key words of this technique.
Cost per functional property ” Determine the actual amount spent per functional property. For example, in wiring harnesses, what is the cost per ampere conducted , on a mechanical component, per pound of weight supported or per inch pound of torque transmitted? This gives a basis for a direct comparison. The function can then be evaluated by comparison. This is a basic value control technique.
The use of these cost analysis techniques will literally explode costs in such a way that a circle can be drawn around the areas that show where work is required. The functional approach techniques can be used to study the high cost area. It does not follow automatically that high cost is unnecessary cost. High cost may be unnecessary cost, but we must use other value tools to find out if it really is.
Technique 5: Determine Functional Area Costs
One purpose of this technique is to help answer the question, "where should effort be applied?" If the study item is a part or a simple assembly (two or three parts), then the scope is already defined. If the project is a complex assembly which could have its principle of operation changed by a new design concept, questions such as available time, savings potential, type of improvements, stage of product maturity, etc., should be considered .
Divide the present cost into functional areas to define the project scope. Division of cost into functional areas will pinpoint high cost differently than usual cost visibility analysis, and will help to broaden or narrow the scope of study. This will direct effort to more profitable areas. An example is shown in Figure 12.5.
| Part Name: | |||
|---|---|---|---|
| Functional area | Present cost | Hi | Low |
| X | |||
| Y | |||
| Total cost | |||
Figure 12.5: A form that may be used to direct effort.
FUNCTION DETERMINATION
Function analysis is the foundation of value control. A product or system is not analyzed from a part or action standpoint, it is analyzed from a function standpoint to break down the barriers to visualization for improved creativity and the development of the maximum number of practical alternatives. The objective is to obtain the maximum benefit possible; cost reduction is often as high as 30 to 100 percent. Function analysis makes it possible to set high cost reduction goals and to meet them. This can be done because basic functions are identified and isolated, and other methods to perform them are developed through the use of applied creativity. The function approach requires that certain definitions, ground rules, techniques, and relationships be understood .
Experience has shown that function analysis combined with the systematic approach of the job plan will almost invariably produce desired cost reductions. However, the goal of eliminating all unnecessary costs is dependent upon the skill, training, dedication, and organizational support attained.
What Is Function?
Function is the property that makes something work or sell. Function states what the product or system does. It is the objective of the action, the result to be accomplished, and can be defined in some unit of measure such as weight, quantity, time, money, space, or some other practical measure.
Functions are expressed in two words, a verb and a noun. The use of only two words forces a brief or terse definition of the necessary characteristics. The use of two words avoids the possibility of combining functions and of attempting to define more than one simple function at a time. The two word requirement aids in achieving the broadest level of abstraction. It is a forcing technique that causes a struggle to clarify understanding and aid visualization for creativity.
Proper identification of function involves a point of view. The function must be identified in such a way that is stripped of all restrictions that would inhibit development of new and better ways to provide the function.
For example, consider the fastening of a simple nameplate to a part. One might describe the function that applies as "attach nameplate." It would be far better to describe the function as identify product, because a nameplate is only one of many ways to achieve the desired function. Nameplates might be riveted, welded, or cemented. However, it is also possible to identify products by etching, stamping, molding, or printing on the part, thereby eliminating the nameplate altogether. Some examples of functions are:
| Support weight | Improve appearance | Create design |
| Transmit torque | Establish style | Evaluate information |
| Enclose part | Increase prestige | Develop plan |
| Conduct current | Decrease cost | Survey market |
| Amplify voltage | Create style | Change attitude |
Identifying the function in broadest terms provides the greatest potential for value improvement because it allows greater freedom to creatively develop better value alternatives. Further, it tends to overcome any preconceived ideas of the manner by which the function is to be accomplished.
Basic and Secondary Functions
Basic Functions
There are two types of functions: basic and secondary. Basic function is the specific purpose for which a device is designed and made. Or stated another way: basic function is the performance feature that must be attained if the total item or system is to work or sell. Consider a screwdriver. "Transfer torque" is the basic function. If this function is eliminated, the screwdriver will not work.
A clear understanding of the user 's need is necessary if a satisfactory basic function definition is to be developed. For example, if the desired application is to pry open paint cans, the function would be defined in terms of the transfer of a linear force. A screwdriver could perform this function but the "transfer force" function may be provided at lower cost if "transfer torque" is eliminated. A plain, flat strip will transfer force without the costly handle. Make sure your study item has a basic function; otherwise , it can be eliminated.
Secondary Functions
Secondary functions are the result of performance features of a system or item that have been added because of the method chosen to accomplish the basic function. They may help the product work a little better and sell better; in other words, they support the basic function. In the case of the screwdriver, its secondary functions would be:
| Transmit information | Upgrade appearance | Resist force |
| Multiply torque | Prevent slip | Reduce wear |
| Resist corrosion | Increase leverage | Insulate user |
Can you determine what parts perform these functions in a typical screwdriver?
Secondary functions are sometimes unwanted or unnecessary. An example would be "make noise." We have a complete sound laboratory trying to eliminate or control noise on our cars . On the other hand, money was added to the turn signal flasher to "increase noise" and then later to "control noise."
In the automobile business, styling is a major factor. Styling features may be basic or secondary. However, whether they are basic or secondary is more subjective than in a mechanical part. For this reason, good supporting marketing data are required to guide and advise the stylist of the consumer's attitude and requirements.
FUNCTION ANALYSIS AND EVALUATION
There are six distinct function evaluation techniques to help clarify problems and identify unnecessary cost. The problem will dictate which techniques are needed. The order in which they are given here has no particular significance; skill develops through application. Practice will eventually provide a methodology that will best fit problem needs. The six techniques are:
| Technique 1 | Identify and evaluate function |
| Technique 2 | Evaluate principle of operation |
| Technique 3 | Evaluate basic function |
| Technique 4 | Theoretical evaluation of function |
| Technique 5 | Input output method |
| Technique 6 | Function analysis system technique |
Technique 1: Identify and Evaluate Function
This is a simple technique that asks the question "what must the part or assembly do?" It applies to all projects and requires a clear determination of all use and esteem functions. Each function should be expressed in two words ” see Figure 12.4.
After all functions have been listed, classify them as basic or secondary ” refer to definitions of basic and secondary in the ground rules. This technique clarifies the function, prevents combining of functions, and reveals the relationship of basic and secondary functions.
Technique 2: Evaluate Principle of Operation
This technique is essentially the same as technique 3, except the emphasis is on principle of operation. This technique requires a detailed examination of the physical laws or effects upon which the function could be based, to allow a simpler, more reliable, and less costly operation. For example, to provide data on auto engine temperature, a "transmit information" function based on laws and effects that respond to heat might be replaced by one based on magnetic principles.
This approach has broad application on new items and can be a useful tool in the advance departments or research departments on developmental items. For example, in the development stage, the decision to provide mechanical, electrical, vacuum , or other means to provide automatic temperature control would have an effect on the system design.
Technique 3: Evaluate Basic Function
This technique imposes the strictest discipline and requires the acceptance of a forcing assumption: "only basic function has value." The assumption is made as a mental step in order to force our thinking to search for new and simpler designs that will provide the basic function in such a way that the least number of secondary functions is required to make it work and sell.
This technique is best applied to assemblies; however, it can be modified to single parts. The blast-create-refine technique as described in detail in the creative phase is an example of a special case of this technique. The value, as it is developed here, is the combined result of individual judgment, creativity, and past experience that expresses what the function should cost based on the work it performs (and the way it could be done).
There are many variations to this technique. One is to expand the scope of study and eliminate imposed functions by revising each listed function determined in technique 2 and asking the question, "Is this function performed this way as a result of the basic design concept?" Redesign to eliminate imposed functions means expanding the scope thereby causing adjoining components to dictate new limits. Some of the largest savings, 50 to 80%, will come using this technique.
Technique 4: Theoretical Evaluation of Function
The theoretical evaluation of function places a precise value on a function by using appropriate mathematical relationships. It applies to measurable parameter functions only, such as "create heat" and "resist bending," as opposed to functions that provide appearance, maintain decor, etc.
For example, if we were to plot the cost in cents per foot against the torque carrying capacity for various materials, we would see that the graph instantly will highlight the cost required to satisfy the function "transmit torque." This approach takes value engineering from an art to a science and opens the door for value research. While the basic concept is still the same, equating cost to function, a considerable grasp of basic value techniques and mathematics is required.
Technique 5: Input Output Method
This technique is useful in highlighting the basic function of a product by viewing it as a black box item that receives certain inputs and transforms them into outputs. These inputs and outputs are not functions and therefore do not have to be defined in terms of two words. The function itself is a result of the input and it causes the output; hence, the function is positioned between the input and the output.
In the example below, 6 volts DC is the input to the transformer and 12 volts DC is the output. The function that fits between the input and the output is "amplify voltage." Additional examples of this technique are listed below.
| Item | Input | Function | Output |
|---|---|---|---|
| Transformer | 6 volts DC | Amplify voltage | 12 volts DC |
| Hot water | Cold water | Heat water | Hot water |
| Heater | Power | Convert energy | Heat |
| Pipeline | Fluid | Transmit fluid | Fluid |
It should be noted that any item may have more than one input or output, and that unless inputs are transformed into outputs, the item has no value. Since function is the key link between input and output, this is equivalent to stating that only function can have value.
Technique 6: Function Analysis System Technique
This technique is the primary function analysis technique used in most cases. This system was developed to assist in performing function analysis on a complete system. The use of determination logic helps to identify and verify the basic functions and also helps identify higher and lower level functions and supporting systems. The technique requires construction of a FAST (Functional Analysis System Technique) diagram by the use of determination logic questions: How? Why? and When? The steps necessary to complete a FAST diagram are:
-
List all functions performed by the assembly or system on Figure 12.4. Be sure to identify each function by a verb and noun. Review and check proper columns to identify basic and secondary functions. This is actually technique 2.
-
Prepare a 1" — 2" card (or a Post-it note) for each function listed in Step 1. Take a close look at the functions and indicate the relationship of all functions to each other. This requires determination of the next higher level function for each known function. In other words, find the functions that cause other functions to be performed. In order to do this, ask three questions about each of the functions listed in Step 1 to identify the functions that will link other functions together. Each question must be answered specifically.
The logic questions are:
-
How? How is this function accomplished?
-
Why? Why is this function performed?
-
When? When is this function performed?
Select the function you think is the basic function and apply the logic questions to the right and left of the basic function. Ask how the function is performed to determine the function to the right. Ask why this function is performed to determine the function to the left. It may be necessary to select more than one of the functions to get the correct basic function.
Ask why? < -------------------------Control Air -------------------------> Ask how?
In the example, the function "control air" is selected as the basic function. How is air controlled? The reply is "direct air" and " modulate air." Both answer the "how" question. Do they both answer the "why" question? Why is the air modulated? Why is the air directed? The answer is to "control air." The logic questions are satisfied and we can add the next FAST diagram block ” see Figure 12.6.
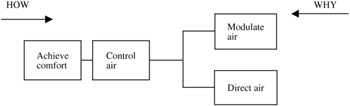
Figure 12.6: Second step in the FAST diagram block process.
Now the question "why do we control air?" must be answered. The reply is "achieve comfort." How do we achieve comfort ? Control air. So the basic logic questions have been satisfied for the basic function "control air".
The basic function has been isolated, and the rest of the primary path functions can be determined. These primary path functions become the basic framework for developing a complete FAST diagram. The "how" and "why" logic questions must now be applied to every function. Each must satisfactorily answer the question relative to its position in the diagram. For example: If we take the function "modulate air," we can further analyze it into vary opening, direct force, apply torque, apply effort.
Whenever these questions are answered satisfactorily, the position of a known function is established within the FAST diagram. In some cases a new function is discovered . Then the primary path questions must be asked of the new function.
This step identifies the relationship between a low-level and a high-level function, with the highest-level functions on the left. It identifies functions that are the result of other functions and functions that cause other functions. Unless you understand these relationships, it will not be possible to develop a FAST diagram, which is necessary to stimulate creativity and to clarify the relationships of parts or actions.
When the primary path has been selected and positioned on the chart, position all secondary functions that did not fit into the primary path by applying the "when" question and adding them below the primary path. All of the functions listed may not be functions; some may be specifications or objectives. Show the objectives and specifications on your FAST diagram in phantom blocks in the upper left corner of the diagram.
This completes the construction of the FAST diagram but does not complete the information that can be added to it to provide the total assembly picture. The function cost worksheet (Figure 12.3) can now be completed by listing all functions horizontally and all parts and process costs as determined from the detailed cost data. Remember: the cost information should be for a specific function. A partial cost function FAST diagram is shown in Figure 12.7.
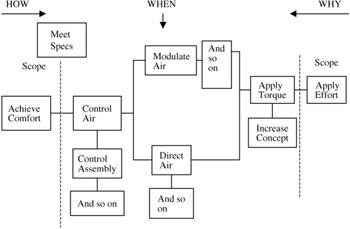
Figure 12.7: A partial cost function FAST diagram.
The parts that perform each function can also be added to the FAST diagram. This step will define the high cost areas and point out where to concentrate creative effort. By analyzing the FAST diagram, you can find interesting creative relationships. The function to the right of the selected function tells how this function is performed. The function to the left tells why this function is performed. The function below or above tells when, and that listed immediately below the function tells what performs this function.
These simple words ” how, why, when, and what ” stimulate creativity. The answers also keep your thinking close to the area in which a change is being sought.
In further utilization of your FAST diagram, try incorporating secondary functions into existing parts by modification to the part. You will have the most success if the functions are next to each other or happening at the same time.
This technique may be applied to existing or proposed designs, concepts, procedures, processes, documents, or any type of software. The primary purpose is to identify functional relationships to stimulate creativity.
Cost Function Relationship
The FAST diagram clearly identifies functions and their relationship to each other. The techniques of cost visibility identify high cost areas. These techniques can now be combined to clearly identify the relationship between cost and function. This will make it possible to identify the areas of unnecessary cost for the application of creative problem-solving techniques.
The cost function worksheet (Figure 12.3) is the basic tool. The functions are listed across the top from the FAST diagram. The parts, processes, or actions are listed vertically with their actual costs ” see format in Figure 12.7.
It is now necessary to determine the actual cost of each function by applying the cost for the part or action that causes the function to be performed. In many cases, it may be necessary to break the cost down into several functions. For example, say in a foldout sample, the thumbwheel costs $.0957. This is distributed over three functions: provides decor, apply torque, limit rotation. The percentage of cost applied to each is a matter of qualified judgment unless a detailed breakdown can be obtained.
In our example, let us assume that the function "modulate air" is made up of the cost of three items totaling .1100. This is the cost of the function "modulate air." In order to find the cost of the system to modulate air, all of the functions in the critical path plus the supporting functions must be totaled. This cost is, say, $0.2699 or X% of the total assembly cost. In other words, if the modulate air function could be eliminated, $.2699 could be removed from the assembly.
These function costs can be applied to the FAST diagram for convenience. This enables a ready determination of what can be accomplished by eliminating or combining functions to provide a less costly assembly.
When used in conjunction with the FAST diagram, the cost function worksheet provides an accurate function cost. This can then be evaluated in terms of its value or worth. By the application of creative techniques, new ways to perform the desired function can be developed.
Evaluate the Function
After a FAST diagram is complete, with part or action costs or assigned to the proper functions, values can be assigned to each of the functions. By assigning cost first, the task force members become familiar with detail costs and are therefore better prepared to assign values to the functions by comparison.
Value is defined as the lowest cost to reliably perform a function. In evaluating a function, the value or worth used must be the intrinsic value, not the result or effect of that function, and it does not include other functions on the FAST diagram. (During this phase of the job plan, the team must be optimistic, just as in the creative phase; if not now, when will the team be optimistic?)
One of the easiest ways to determine value of a function is by comparison to another method to perform the function at a lower cost. For example, in a given design, the "support weight" function was performed by a columnar part of its attachment, for a function cost of 23 cents. The team assigned a value of 5 cents for the "support weight" function because the team members reasoned that the specified load could be supported in suspension for that amount. At this time, the team did not have a solution to the problem, but during the brainstorming session the team generated proposed changes that were developed to accomplish the overall target.
In many cases, function values cannot be assigned by comparison, and other means must be used such as:
-
Apply the test for value ” How much of my own money would I pay for that function?
-
Rate function numerically ” Apply ratios to function cost to arrive at new values.
-
Apply VE techniques for lower cost ”Set a goal or target for functions (percentage reduction).
-
Others ” Make use of other information, such as noticeable differences, value standards, and mathematical comparisons.
The sum of the individual function values establishes a product or total system value; this becomes the team's new target. Now the team knows which functions to attach during their creative sessions ” the high cost and low value functions.
Once these values have been established by the team, place this assigned value in the upper right-hand corner of the function box. The team has isolated the problem and set its own goal(s) for improvement.
Remember these ten tests for value:
-
Can we do without it?
-
Does it need all of its features?
-
Does it cost more than it is worth? Is anyone buying it for less?
-
Is there something better that can do the job?
-
Can it be made by a less costly method?
-
Can a standard item be used?
-
Does it cost more than the total of reasonable costs for material, labor, burden, and profit?
-
Can a less costly tooling method be used, considering the quantities involved?
-
Can another dependable supplier provide it for less?
-
Would you pay the price if you were spending your own money?
EAN: 2147483647
Pages: 235