Visualizing Acceleration and Second Derivative
| < Day Day Up > |
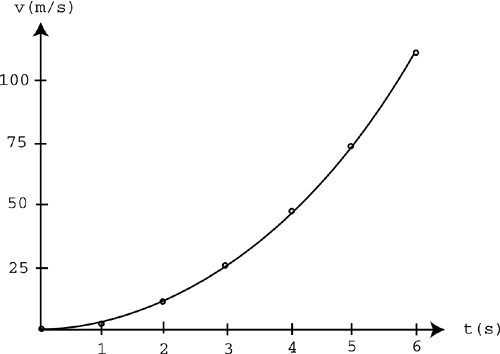
| The preceding section took a closer look at instantaneous velocity, and you ended up computing derivatives. This section goes one step further by delving deeper into the realm of acceleration, which leads to the concept of a second derivative. Let's start by taking a graphical approach again. Rather than graph an object's position versus time, let's graph an object's speed or velocity versus time. Suppose a race car driver starts at a dead stop and floors the gas pedal. At regular intervals, his instantaneous velocity is recorded. These values are shown in Table 9.2. Table 9.2. A Race Car's Velocity at Various Times
You can graph these points to see how the race car speeds up over time, as shown in Figure 9.5. Figure 9.5. A graph of the values shown in Table 9.2. As you can see in the graph, as time increases , the race car continues to speed up. We can also say that the velocity ( v ) is a function of time ( t ). That is, the velocity changes as the time increases from 0 to 6 seconds. Mathematically, this can be written as v = f ( t ) and read as "Velocity is a function of time." Notice the parallel between the preceding section and this one. So far, they're almost identical. Just as you did last time, use the graph shown in Figure 9.5 to reexamine the concept of acceleration. Suppose you wanted to know the average acceleration of the race car over the full 6 seconds. If you approached this numerically , as you did in the preceding chapter, you'd have to calculate the change in velocity and then divide it by the 6-second time interval. Using the new notation, it would look like this:
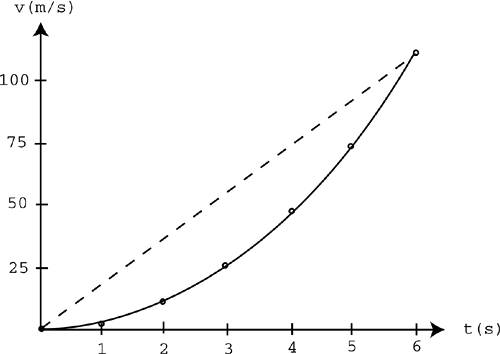
You can also use the graph to visualize this. Remember the good old slope formula? Slope = rise over run. In this case, the rise is the change in velocity, and the run is the time interval, so the average acceleration is simply the slope of the line between those two points on the graph, as shown in Figure 9.6. Figure 9.6. The average acceleration over the first 6 seconds. Try plugging the coordinates of those two points into the slope formula. You'll find that you repeat the same process you did earlier. The slope of the line between any two points on a velocity-versus-time graph gives you the average acceleration over that time interval, just like the slope of the position-versus-time graph gives you the average velocity. Example 9.4: Finding Average Acceleration Using the data from Table 9.2, find the average acceleration of the race car for the time interval 2 Solution:
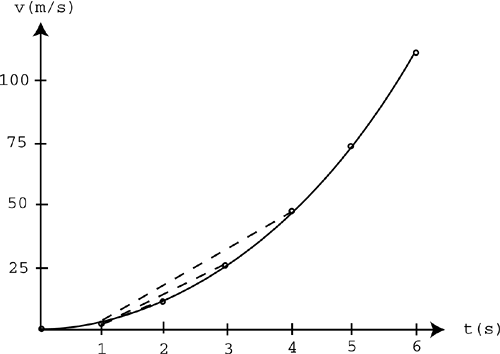
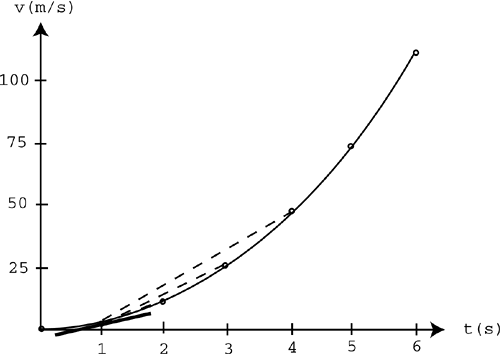
At this point, you can calculate the average acceleration over any time interval. Let's look at what happens when you take smaller and smaller time intervals. Suppose you want a better understanding of how the race car speeds up at exactly t = 1s. You can calculate the average acceleration between 1 and 4 seconds: You can calculate the average acceleration between 1 and 3 seconds: You can calculate the average acceleration between 1 and 2 seconds: These smaller and smaller time intervals are illustrated in Figure 9.7. Figure 9.7. Smaller time intervals close to t = 1. You can continue to take smaller and smaller time intervals until the line segment approaches a point or an instant in time. This leads to the concept of instantaneous acceleration. Look at the dashed lines in Figure 9.7. As the time intervals get smaller and smaller, the dashed lines approach the bold line shown in Figure 9.8. This bold line represents the slope at the point where t = 1s. That slope is the instantaneous acceleration at exactly 1 second. Figure 9.8. The instantaneous velocity at t = 1. The average acceleration is the slope of a line segment over a time interval on a velocity-versus-time graph. The instantaneous acceleration is the slope at a point on the graph. This follows the same exact pattern as velocity did with the position-versus-time graph. Again, the smaller time intervals lead to the concept of the limit. As you take smaller and smaller time intervals, you'll find that the average acceleration approaches some number. That is the instantaneous acceleration.
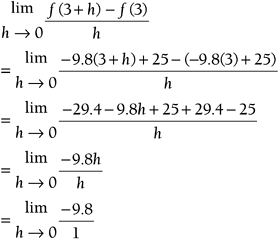
Example 9.5: Finding Instantaneous AccelerationSuppose another grenade is thrown into the air in a game like Half Life , and its instantaneous velocity is a function of time. If its velocity is v = f ( t ) = 9.8 t + 25, find the instantaneous acceleration at t = 3s. Solution
Here's where the limit notation comes into play. If h keeps getting closer and closer to 0, the instantaneous velocity gets closer and closer to 9.8. Just like before, you just computed a derivative. Acceleration is actually the derivative of velocity with respect to time. If v ( t ) gives instantaneous velocity as a function of time, acceleration is v '( t ).
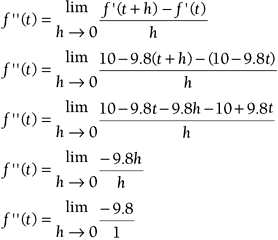
Here's where we take a big step. If acceleration is the derivative of a velocity function, and velocity is the derivative of a position function, acceleration is the second derivative of position; it's the derivative of the derivative. The second derivative is written as f ''( t ).
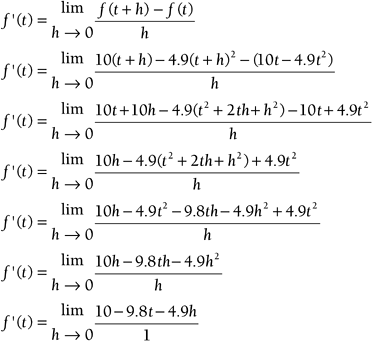
Although this notation might look intimidating, it's just a repeat of the preceding section. If you're looking for the acceleration at a point and you know an equation for the instantaneous velocity, simply take the derivative. However, if all you have is an equation for the position with respect to time, simply repeat the derivative process (take two limits). Example 9.6: Finding the Second DerivativeLet's revisit the grenade one more time. Suppose all you have is an equation for the height as a function of time: y = f ( t ) = 10 t 4.9 t 2 . Find the instantaneous acceleration at t = 2s. Solution
This chapter not only explored a graphical approach to the concepts of velocity and acceleration, but it also looked at using derivatives to express velocity and acceleration. You even found an interesting link between position, velocity, and acceleration: The derivative of position is velocity, and the derivative of velocity is acceleration. If you can model an object's position as a function of time, you can use the derivative to get two simple equations for velocity and acceleration to put into your code. This chapter used polynomial functions (powers of t ) to model the position because they are easy to work with. Again, if you want to model an object's position with a different equation (other than polynomial), Appendix B lists texts that provide you with tricks for finding the derivative of other equations. I encourage you to investigate this further. Self-Assessment2.
|

| < Day Day Up > |
EAN: 2147483647
Pages: 143