Chapter 13: Statistics of Spam
|
| < Day Day Up > |
|
Spam’s Stats
So far we’ve discussed how spam is sent, the legal repercussions, and what it costs. This chapter is dedicated to the statistics of spam. I’ll talk about who sends the most spam, the most common type of spam, and spam trends. All statistics here are collated from my own spam filter logs, typically taken from a corpus consisting of 100,000 spam messages spread throughout the year 2004. Results in this chapter should not be considered typical for everyone; they are my own personal statistics, and you will find that these figures vary from person to person. Many factors govern the types of spam you receive—from how old your e-mail address is to how many people know it and what you do with it. All these factors influence the types and amount of spam you receive. However, some facts and findings you’ll see here will be useful in dispelling myths and misconceptions about where spam can (and does) often come from.
Where Is It Coming From?: Top Spam-Sending Countries
Although you might have a preconceived notion that the majority of spam originates in Russia or China, would it shock you to know that just under 50 percent of all spam I received in 2004 originated in the United States? These statistics are found by tracking down the country that the sending IP address is located in. Each IP address on the Internet clearly identifies its country of origin, and after writing a small application, I was able to read over my spam logs and collate the top 12 spam-sending countries. Although these hosts could be located in a country such as the United States, this does not mean that the spammer is located in the same country. These are more than likely compromised home computers or home networks running insecure proxy servers.
The findings do show, however, that the United States has a large number of high-speed Internet users and that Americans are possibly behind the rest of the world in terms of home user security. For example, Asia has a higher percentage of broadband implementations nationally, although Asia accounts for only a very small part of the spam sent globally.
In Figure 13.1, America comes out on top, accounting for 46% of all spam I received. South Korea and China are close behind, with 16% and 11%, respectively. These three countries have readily available broadband connections, and the majority of their home users have cable/DSL or some other form of high-speed bandwidth in their homes. Although Europe has an equally large number of broadband and high-speed Internet users, the entire European Union accounts for sending less spam than China. Mexico and Brazil are fast-growing spam havens, since these countries have very relaxed laws around both spam and spam regulations and a judicial system that poses little threat. These results are comparable to other published statistics (www.commtouch.com/ news/english/2004/pr_04063001.shtml). Recent studies show that the majority of spam sent now originates from the United States, perhaps mostly due to virus and worm outbreaks that tend to plague U.S. networks and home DSL users.
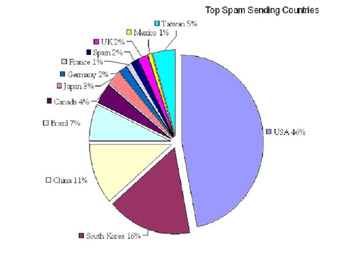
Figure 13.1: Top Spam-Sending Countries
What Is It?: Types of Spam Sent
Pornographic Web sites and pornographic services accounted for over 70 percent of all spam sent in the early days of the Internet. In mid-1998 (before the invention of Viagra), porn was the largest-selling item on the Net; it made money and lots of it. Porn spam became so great that it saturated the entire market and caused a huge downward spiral in both the pornographic industry and its relationships with spammers. So much porn spam was circulated in the early days that porn sites began to receive a lot of bad press, losing their reputation and any shred of favorability with the public.
Modern-day spam is much different. Spammers have branched out into many different avenues of products and services. The Internet has also seen the growth of fraudulent spam that has become a large player in the spam game. Figure 13.2 shows a per-category breakdown of the spam I received between January and October 2004, with each spam message categorized into its relevant group. Pornographic spam is no longer even a contender for the most prevalent type of spam; product-based spam is the new-age favorite and accounts for the majority of all spam sent.
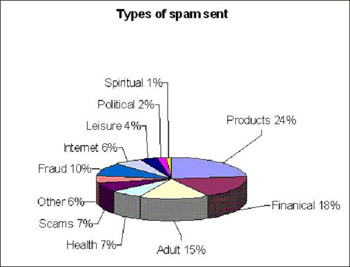
Figure 13.2: Types of Spam Sent
For the first time, spiritual and political spam together account for over 3 percent of all global spam sent, showing that even spammers can think outside the box of simply selling Viagra.
Product-based spam is still by far the most popular form of spam. These products are composed mostly of online pharmacies peddling sexual performance enhancers or quick-fix weight-loss remedies. Even newer in the last couple of years is financial-based spam—products such as debt consolidation and low-interest mortgage rates are now the “in things” to spam. The sudden surge in interest in these products is due the high levels of income a spammer can make from successful referrals. Other spam that does not fall into these major categories makes up 6 percent of global spam, including spam in which the body of the message is blank, abuse and hate mail, and annoying chain letters.
Although the CAN-SPAM Act requires pornographic spam to contain a warning or message prefix to inform the user that the spam is sexually explicit in nature, Viagra and other sexual performance enhancers do not require such a warning. Although this rule has hindered the trade of pornographic spam, it has had no effect on product-based spam that promotes a sexually explicit product but does not require obvious labeling.
Recent studies have proven that over 50 percent of all Viagra sold online is fake. A study conducted by Dr. Nic Wilson, of the University of London, found that over 50 percent of all Viagra sold online is indeed either a placebo and contains no active Viagra components or is a vastly diluted version of the sexual enhancer. All pharmaceutical products were, however, packed in official Viagra packaging, looking the part and deceiving many customers. Next time you buy Viagra online, you should know that there is a high chance that it’s fake.
Who Is Sending It?: Top Spoofed Domains
As mentioned earlier in this book, during the process of sending spam, any reply address can be specified in the message header, and only rarely does spam contain a legitimate or nonfalsified address. Falsified reply addresses can have a large indirect effect on mail hosts, which have to deal with millions of bounced messages. More times than not, the person who appears to be sending the spam doesn’t even exist.
Take the following example. Spammerx.com sends a spam e-mail to joe@company.com, jack@company.net, mark@company.co.jp. The reply address of each spam message is spammerx@webmail.com, although the message was sent from spammerx.com and had nothing to do with the domain webmail.com. However, Joe’s mailbox at company.com is currently full and the mail server is unavailable to deliver the message, so an error message is sent back to the supposed sender, spammerx@ webmail.com, to inform him that Joe is unable to receive the message that was sent to him. This can be a very effective attack against a network host when many hundreds of millions of spam are sent, all appearing to come from webmail.com, which causes the mail servers at webmail.com to process millions of bounced messages all from spam.
This indirect attack is a driving reason for companies such as Microsoft to seek legal action against spammers. The major cost to the company is not necessarily from the spam users receive but instead in the hundreds of millions of bounced messages it has to process. These bounced messages, although unrelated to the server’s own users, cause a huge backlog in processing time, hindering the delivery of legitimate mail or other spam.
Figure 13.3 is a chart of the top reply domains used in my spam archive. Although the reply address may be, for example, @msn.com, the message did not come from any msn.com user. Spammers use fake reply addresses to make the spam seem more legitimate; in no way do these statistics suggest that the domains used are responsible for sending spam.
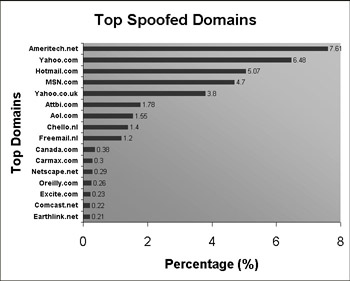
Figure 13.3: Top Spoofed Spam Domains
The ISP Ameritech.net takes first place for the most popular reply address, with 7.61 percent of all my spam containing a reply address from this U.S. ISP. Collectively, Microsoft takes second place, with both hotmail.com and msn.com being very popular domains, whereas yahoo.com and yahoo.co.uk are equally popular with spammers. These domains are often used as the default reply address in major spam-sending programs. Usually a list of five or 10 reply domains are listed by default, and hotmail, msn, and Ameritech are always included somewhere. This accounts for so many people spoof their domains, and they might not even be aware they are doing it.
Spammers are not very creative with reply addresses and, as previously shown in this book, faking a reply e-mail address at hotmail.com or msn.com will almost certainly raise some suspicions with spam filters. It would seem, however, that the majority of spammers have now caught onto this fact, since the top five common spam domain names account for only 33 percent of the total spam sent. More and more, spam is being sent using randomly generated domain names, leaving a much more subtle trail.
How Much Is Out There?: Amounts of Spam
In the beginning of 2004, I set up one spare mail account on my mail server. I used this account to post to online news forums, and within a week of my first post, the account began to receive spam. I posted at least 20 messages on various forum Web sites, listing my correct e-mail address, and waited to see how large the spam volume would grow. What follows is a statistical look at the amount of spam my account received.
All spam sent to it came directly from spammers harvesting e-mail accounts from the Web. Since my original 20 posts, I have ceased to use this e-mail account, and its only practical use is now to follow the trends and habits of the spammers who send mail to it—what products they are selling and what methods they are using to deliver the spam. I find this information highly interesting and educational. Figure 13.4 shows a graph of the increasing amount of spam I received.
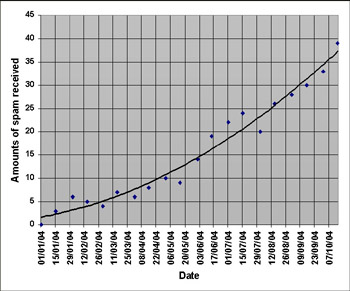
Figure 13.4: Spam Trends
The results are based on the amount of spam sent to my account on the first and fifteenth of every month. As you can see, the trend in the graph is very obvious and leaves little to the imagination about how fast my e-mail address was traded between spammers.
The account probably started in the list of one or two spammers, but by the beginning of June was sold to many more spammers, and the list was attracting all types of spam. In the beginning of year, I was targeted by only one spammer, since all spam I received was of a similar nature. Each spam was purely plaintext and linked to a random .info domain, mostly selling pharmaceutical products, although I did receive two other products (massage oil and discount cigarettes) that all followed the same message style.
By June, at least six different spammers were mailing me, and I began receiving OEM software spam, 419 scams, and a lot of Viagra-specific spam. Currently, I estimate that at least 10 or 20 spammers have my e-mail address, and many subtrends are visible in my spam—for example, every two weeks I receive pornographic spam from one particular adult site, and at least once a week I receive spam in Russian, advertising an ISP in Russia (I think).
An e-mail account such as this is well worth the trouble. This account has allowed me to watch spam and spammers, to observe new spam-sending techniques and current products that are popular to sell. Most personal e-mail accounts such as this one will follow a similar trend: Each address is sold or traded between a multitude of other spammers, and the range of spam you receive becomes much greater. You can probably tell when a new spammer gets your e-mail address; the spam may look a little different or sell a different or distinctive product that you are not used to receiving.
Yearly Trends
Spam follows very clear yearly cycles that correlate with several other world factors. First, the release of worms and Trojans on the Internet causes large peaks in the amounts of spam activity, due to the increased number of infected hosts used to relay spam. Second, holidays and natural disasters often play a large role in spam statistics. Spammers are people too, and no one likes to work on Christmas or Easter, and spam generally quiets down around festival seasons or when a major natural disaster strikes a region.
Figure 13.5 is an example of data from a friend’s mail server and the amounts of spam he filters yearly. These statistics have some very definite peaks and trends that can be associated with other trends.
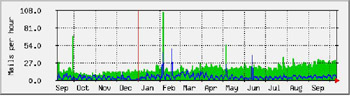
Figure 13.5: Yearly Spam Trends
With the black lines, we see that over the last year the amount of spam received has remained reasonably constant, while the grey lines (which indicate a message contains a virus or Trojan) have had several strong peaks throughout the year. These peaks are due to the release of a new worm on the Internet. Notice that there is a spike in the amount of spam sent just after a worm is released. This is due to the number of hosts that are now infected by the worm and acting as spam relays. We can see this happened in early October the previous year, twice in February this year (probably caused by the worm MyDoom.A and MyDoom.B), and again in May and mid-June. This host keeps an up-to-date spam rule set, and the owner is very vigilant about trying to stop spam and having the best filtering rules in place.
Yearly statistics bring some interesting information to hand; it is very typical that spam rates will peak around the beginning of December, more than likely spurred by the financial needs of spammers. Christmas is an expensive time for anyone. Christmas and New Year’s Day are usually some of the quietest days in the year for spam. In Figure13.5 we can see that practically zero spam was received between Christmas and New Year’s.
Holidays might be some of the lowest spam-sending days in the year, but ironically, spammers should use these days more.
On Christmas Day, most people are not chasing spammers, worrying about reporting spam, or really doing anything but eating turkey and enjoying the day with their family. Even geeks relax from time to time, and Christmas is definitely a day to relax.
Spam sent on Christmas Day would have a higher chance of evading the human element involved in spam filtering. Spam filters such as spam-assassin and spam cop would of course still be functioning, but any antispam campaigner would be too full of turkey to chase down a rogue spammer. Spam-hosting Web sites also typically last longer over the Christmas period, since most ISPs and network providers do not actively check abuse e-mails on Christmas Day—usually the job of the systems administrator or IT security department, who do not typically work on Christmas.
Additionally, the majority of consumers in the world have at least two or three days off after Christmas, so if you were to send a few hundred million spam out on Christmas Day, those messages would be ready, sitting in their in-boxes for them to read on their return.
Typically speaking, the longer a host is providing a mail service, the more spam it will deal with daily. This trend correlates to a general trend of user e-mail addresses being traded or passed among other spammers. The more spammers who have an e-mail address, the more spam that address receives. Therefore, a host that processes 10,000 spam a month may look to process 20,000 or 30,000 spam in the same month the following year.
Spam is very much an evolving process, and the human element involved can leave some very distinctive statistics and trends behind. Natural disasters, power cuts, and the release of worms and Trojans often greatly influence spam statistics, proving that spam originates from real people, not just faceless machines.
Your Own Statistics
Spam is a marketing wonder, a digital mastermind in the online world, and the success of spam is based on the astounding statistics that surround it. Spammers are easily the largest marketers in the world, with more reach and impact than any corporation existing today.
If you are curious about the statistics around your own spam, try analyzing the spam you receive and watch your own trends throughout the year. Your results should be very interesting. I recommend using a Perl module called Mail::Graph (http://search.cpan.org/~tels/Mail-Graph-0.13/), which will create very detailed graphs on your personal spam statistics and allow you to understand how “your” spammers are operating. If you are new or unfamiliar with Perl, there is a sample script inside the Mail::Graph package that will show you step-by-step how to create your own spam statistic website.
|
| < Day Day Up > |
|
EAN: 2147483647
Pages: 79