6.2. Building a Regular Chart
| < Day Day Up > |
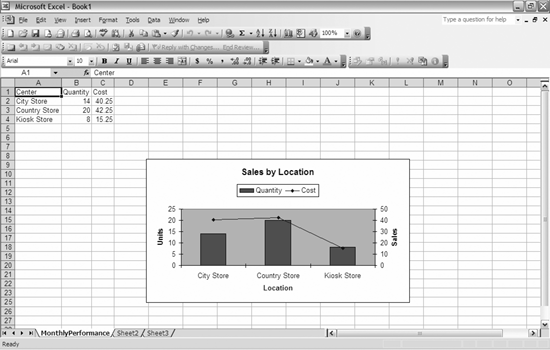
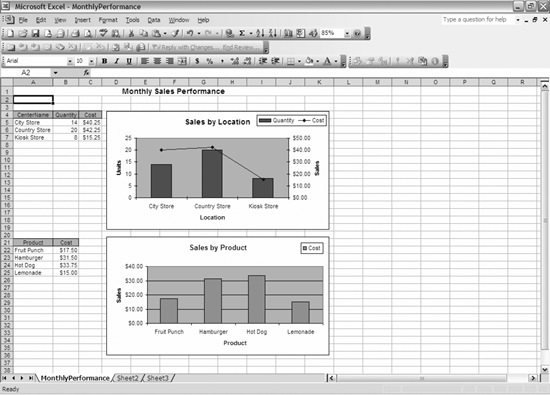
| While pivot charts are very useful, sometimes you want to chart data using a regular chart, or you do not want your users pivoting the data. In these cases, you have a couple of choices. You can, of course, build the chart manually each time you need it. You can also build the chart manually and use automation from Access to push in updated data. If you're feeling ambitious, you can use VBA to build the chart from scratch. If you already have a good chart, I recommend saving and opening it, using it as a template, and just changing the data. However, sometimes this is not practical, or you might not want to rely on having an Excel file available. Also, sometimes clients want a generic charting tool run from Access where they can choose the data they want and have it created in a chart. In cases like that, you have to build the chart each time with VBA. To demonstrate building a chart with VBA, let's start with the data we exported earlier. Assume that you want to show the number of units and total sales of each product in one chart and total sales by location in another on two axes on the first chart and one axis on the other. You can do this with two Group By queries; select the text fields as Group By and select Quantity and/or TotalCost using Sum as the function. For Example 6-4, the queries are saved as qry_SalesbyProduct and qry_SalesbyCenter. Example 6-4. Chart from scratch example Public Sub BuildCharts( ) Dim xlApp As Excel.Application Dim xlwb As Excel.Workbook Dim xlws As Excel.Worksheet Dim xlrng As Excel.Range Dim adors As ADODB.Recordset Dim x, y, z As Integer Set adors = New ADODB.Recordset Set xlApp = New Excel.Application xlApp.Visible = True Set xlwb = xlApp.Workbooks.Add Set xlws = xlwb.ActiveSheet xlws.Name = "MonthlyPerformance" xlws.Range("A1").Value = "Center" xlws.Range("B1").Value = "Quantity" xlws.Range("C1").Value = "Cost" Set xlrng = xlws.Range("A2") adors.Open "Select * from qry_SalesbyCenter", _ CurrentProject.Connection, adOpenStatic xlrng.CopyFromRecordset adors x = adors.RecordCount adors.Close xlws.Columns.AutoFit Set xlrng = xlws.Range(xlws.Cells(1, 1), xlws.Cells(x + 1, 3)) xlrng.Select xlwb.Charts.Add With xlwb.ActiveChart .ApplyCustomType ChartType:=xlBuiltIn, TypeName:= _ "Line - Column on 2 Axes" .SetSourceData xlrng, Excel.xlColumns .Location xlLocationAsObject, "MonthlyPerformance" End With With xlwb.ActiveChart .HasTitle = True .ChartTitle.Characters.Text = "Sales by Location" .Axes(Excel.xlCategory, Excel.xlPrimary).HasTitle = True .Axes(Excel.xlCategory, Excel.xlPrimary).AxisTitle.Characters.Text = "Location" .Axes(Excel.xlValue, Excel.xlPrimary).HasTitle = True .Axes(Excel.xlValue, Excel.xlPrimary).AxisTitle.Characters.Text = "Units" .Axes(Excel.xlCategory, Excel.xlSecondary).HasTitle = False .Axes(Excel.xlValue, Excel.xlSecondary).HasTitle = True .Axes(Excel.xlValue, Excel.xlSecondary).AxisTitle.Characters.Text = "Sales" End With xlwb.ActiveChart.HasLegend = True xlwb.ActiveChart.Legend.Position = Excel.xlTop xlwb.ActiveChart.HasDataTable = False xlws.Range("A1").Select Set xlrng = Nothing Set xlws = Nothing Set xlwb = Nothing Set xlApp = Nothing Set adors = Nothing End SubRunning this code yields the chart shown in Figure 6-4, but it is not obvious how to move the chart around. From VBA, refer to the chart as a shape in the worksheet object and use the IncrementLeft and IncrementTop methods. While it is easy enough to use the methods, it is difficult to determine what values to use for those methods to move the chart where you want it because the values are entered as points. If you need to move the chart, you will most likely have to use the macro recorder and examine the results it produces. For IncrementLeft, positive numbers move it right and negative numbers move it left. For IncrementTop, positive numbers move it down the worksheet and negative numbers move it toward the top of the worksheet. Figure 6-4. The chart from the BuildCharts procedure, formatted completely by code Now that you have had a chance to try building a chart from scratch, let's take a look at a worksheet report published on a monthly basis by a fictional company. There are two charts on one worksheet with the data to the left of the charts, as shown in Figure 6-5. While building a worksheet like this is possible from VBA, it is easier to build it through the Excel GUI and modify the data from VBA. To modify the data using VBA, first you need to determine whether the number of records will change during each refresh. For example, is it necessary to check how Figure 6-5. A worksheet that can be built from VBA, but would be more easily built through the Excel GUI many products or centers are being output, or would a new product and/or center be a rare enough event that it makes sense to modify the template? Example 6-5 shows how to open this workbook and modify the data. Note that your values for the xlFile and xlSaveFile variables will be different. Example 6-5. Modify Excel data example Public Sub ModifyExcelData( ) Dim xlapp As Excel.Application Dim xlwb As Excel.Workbook Dim xlws As Excel.Worksheet Dim xlrng As Excel.Range Dim adors As ADODB.Recordset Dim xlFile As String Dim xlSaveFile As String xlFile = "C:\BookInformation\Chapter6\MonthlyPerformance.xls" xlSaveFile = "C:\BookInformation\Chapter6\MonthlyPerformance2.xls" Set xlapp = New Excel.Application xlapp.Visible = True Set xlwb = xlapp.Workbooks.Open(xlFile) Set xlws = xlwb.Sheets("MonthlyPerformance") Set adors = New ADODB.Recordset adors.Open "select * from qry_SalesbyCenter", CurrentProject.Connection Set xlrng = xlws.Range("A5") xlrng.CopyFromRecordset adors adors.Close adors.Open "select * from qry_SalesbyProduct", CurrentProject.Connection Set xlrng = xlws.Range("A22") xlrng.CopyFromRecordset adors adors.Close Set adors = Nothing xlwb.SaveAs xlSaveFile xlwb.Close Set xlrng = Nothing Set xlws = Nothing Set xlwb = Nothing xlapp.Quit Set xlapp = Nothing End SubOnce you know where the data begins for each query, it is a simple matter of opening up the workbook (instead of using the Add method of the Workbooks collection) and using the CopyFromRecordset method to push the new data into the workbook. Then, to preserve the template, use the SaveAs method of the Workbook object to save the file under a new name. In this example, the axes are set to Automatic, so you do not need to make any changes with code to update either axis when new data is loaded. However, if you want to customize the axes, use the Axes method of the ActiveChart object. Because every type of change is different, it is easier to use the macro recorder and then move that code into your Access VBA code. |
| < Day Day Up > |
EAN: 2147483647
Pages: 132
- Chapter I e-Search: A Conceptual Framework of Online Consumer Behavior
- Chapter II Information Search on the Internet: A Causal Model
- Chapter IV How Consumers Think About Interactive Aspects of Web Advertising
- Chapter XV Customer Trust in Online Commerce
- Chapter XVIII Web Systems Design, Litigation, and Online Consumer Behavior