Memory Manager Components
The memory manager is part of the Windows 2000 executive and therefore exists in the file Ntoskrnl.exe. No parts of the memory manager exist in the HAL. The memory manager consists of the following components:
- A set of executive system services for allocating, deallocating, and managing virtual memory, most of which are exposed through the Win32 API or kernel-mode device driver interfaces
- A translation-not-valid and access fault trap handler for resolving hardware-detected memory management exceptions and making virtual pages resident on behalf of a process
- Several key components that run in the context of six different kernel-mode system threads:
- The working set manager (priority 16), which the balance set manager (a system thread the kernel creates) calls once per second as well as when free memory falls below a certain threshold, drives the overall memory management policies, such as working set trimming, aging, and modified page writing.
- The process/stack swapper (priority 23) performs both process and kernel thread stack inswapping and outswapping. The balance set manager and the thread-scheduling code in the kernel awaken this thread when an inswap or outswap operation needs to take place.
- The modified page writer (priority 17) writes dirty pages on the modified list back to the appropriate paging files. This thread is awakened when the size of the modified list needs to be reduced. (See the section "Modified Page Writer" to find out how you can change this default value.)
- The mapped page writer (priority 17) writes dirty pages in mapped files to disk. It is awakened when the size of the modified list needs to be reduced or if pages for mapped files have been on the modified list for more than 5 minutes. This second modified page writer thread is necessary because it can generate page faults that result in requests for free pages. If there were no free pages and there was only one modified page writer thread, the system could deadlock waiting for free pages.
- The dereference segment thread (priority 18) is responsible for system cache and page file growth and shrinkage. (For example, if there is no virtual address space for paged pool growth, this thread reduces the size of the system cache.)
- The zero page thread (priority 0) zeros out pages on the free list so that a cache of zero pages is available to satisfy future demand-zero page faults.
Each of these components is covered in more detail later in the chapter.
Like all other components of the Windows 2000 executive, the memory manager is fully reentrant and supports simultaneous execution on multiprocessor systems—that is, it allows two threads to acquire resources in such a way that they don't corrupt each other's data. To accomplish the goal of being fully reentrant, the memory manager uses several different internal synchronization mechanisms to control access to its own internal data structures, such as spinlocks and executive resources. (Synchronization objects are discussed in Chapter 3.)
Systemwide resources to which the memory manager must synchronize access include the page frame number (PFN) database (controlled by a spinlock), section objects and the system working set (controlled by executive resources), and page file creation (controlled by a mutex), as well as other internal structures. Per-process memory management data structures are synchronized using two per-process mutexes: the working set lock (held while changes are being made to the working set list) and the address space lock (held whenever the address space is being changed).
Configuring the Memory Manager
Like most of Windows 2000, the memory manager attempts to automatically provide optimal system performance for varying workloads on systems of varying sizes and types. You can use registry values under the key HKLM\SYSTEM\CurrentControlSet\Control\Session Manager\Memory Management to override these default performance calculations. Some of these values are listed in Table 7-1. For more details, see the Windows 2000 resource kit Technical Reference to the Registry help file.
Table 7-1 Registry Values That Affect the Memory Manager
| Registry Value | Description |
|---|---|
| ClearPageFileAtShutdown | Specifies whether inactive pages in the paging file are filled with zeros when the system is shut down. This is a security feature. |
| DisablePagingExecutive | Specifies whether user-mode and kernel-mode drivers and kernel-mode system code can be paged to disk when not in use. If the value of this entry is 0 (the default), drivers and the kernel must remain in physical memory. If the value is 1, they can be paged to disk as needed. |
| IoPageLockLimit | Specifies the limit of the number of bytes that can be locked in a user process for I/O operations. When this value is 0, the system uses the default (512 KB). The maximum value is approximately the equivalent of physical memory minus 7 MB. This registry key isn't used in Windows 2000 Datacenter Server and is no longer used in Windows 2000 starting with Windows 2000 Service Pack 1. |
| LargePageMinimum | Indicates the minimum number of megabytes necessary to map Ntoskrnl and HAL using large (4-MB) pages. (This value isn't documented and isn't present by default; you must add it manually.) |
| LargeSystemCache | Affects whether the file system cache or the working sets of processes are given priority when it comes to memory trade-offs. Also affects the size of the file system cache. (On Windows 2000 Server systems, you can adjust this value indirectly by setting the properties of the file server service—see Chapter 11 for details.) |
| NonPagedPoolQuota | Indicates the maximum nonpaged pool that can be allocated by any process (in megabytes). If the value of this entry is 0, the system calculates the value. |
| NonPagedPoolSize | Indicates the initial size of nonpaged pool in bytes. When this value is 0, the system calculates the value. |
| PagedPoolQuota | Indicates the maximum paged pool (in megabytes) that any process can allocate. If the value of this entry is 0, the system calculates the value. |
| PagedPoolSize | Indicates the maximum size of paged pool in bytes. When the value of this entry is 0, the system calculates the value. A value of -1 indicates that the largest possible size is selected, which means allowing a larger paged pool in favor of system page table entries (PTEs). |
| SystemPages | Indicates the number of system page table entries reserved for mapping I/O buffers, device drivers, kernel thread stacks, or pages for programmed I/O into the system address space. If the value is 0, the system calculates the value. If the value is -1, the maximum number of system PTEs will be reserved. (This value might be needed to support, for example, a device that requires a large number of system PTEs, such as a video card with 512 MB of video memory that has to be mapped all at one time.) |
Most of the interesting "knobs" or controls that affect memory manager policy are kernel variables that contain various thresholds and limits computed at system boot time on the basis of memory size and product type (Windows 2000 Professional being optimized for desktop interactive use and Windows 2000 Server systems for running server applications). Examples of these knobs include the sizing of system memory (paged pool, nonpaged pool, system cache, number of system page table entries), page read cluster size, counters that trigger working set trimming, and thresholds for the modified page writer. To find some of these, search for global variables in Ntoskrnl.exe that have names beginning with Mm that contain the word "maximum" or "minimum."
WARNING
Although you'll find references to many of these knobs, you shouldn't change them. Windows 2000 has been tested to operate properly with the current possible permutations of these values that can be computed. Changing the value of these kernel variables on a running system can result in unpredictable system behavior, including system hangs or even crashes.
The current memory sizes that determine whether Windows 2000 considers a system to have a small, medium, or large amount of memory are listed in Table 7-2. The memory manager uses this value in many of its boot-time calculations.
Table 7-2 Values That Determine System Memory Size
| System Memory Size | Physical Memory |
|---|---|
| Small | <19 MB |
| Medium | 20-32 MB |
| Large | >32 MB if Windows 2000 Professional >64 MB if Windows 2000 Server |
Determining the System Memory SizeBecause device drivers (as well as other Windows 2000 kernel-mode components) might make resource allocation and run-time policy decisions based on memory size values, the following kernel-mode routines have been provided (and are documented in the DDK):
Function Description MmQuery-SystemSize Returns whether the machine has a small, medium, or large amount of available memory. MmIsThisAn-NtAsSystem Returns TRUE for Windows 2000 Server, Windows 2000 Advanced Server, and Windows 2000 Datacenter Server, and FALSE for Windows 2000 Professional. (This routine's name was based on the original product name of the server of the server edition of Microsoft Windows NT, Windows NT Advanced Server.)
Examining Memory Usage
The Memory and Process performance counter objects provide access to most of the details about system and process memory utilization. Throughout the chapter, we'll include references to specific performance counters that contain information related to the component being described.
Besides the Performance tool, a number of tools in the Windows 2000 Support Tools and Windows 2000 resource kits display different subsets of memory usage information. We've included relevant examples and experiments throughout the chapter. One word of caution, however—different utilities use varying and sometimes inconsistent or confusing names when displaying memory information. The following experiment illustrates this point. (We'll explain the terms used in this example in subsequent sections.)
EXPERIMENT
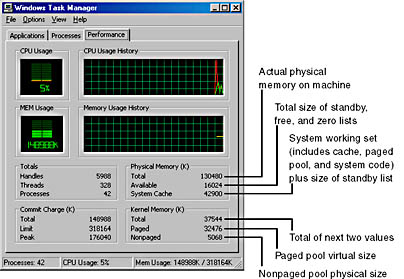
Viewing System Memory InformationThe Performance tab in the Windows 2000 Task Manager, shown in the following screen shot, displays basic system memory information. This information is a subset of the detailed memory information available through the performance counters.
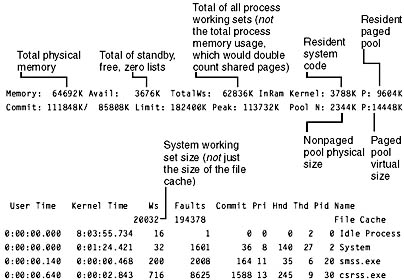
Both Pmon.exe (in the Windows 2000 Support Tools) and Pstat.exe (in the Platform SDK) display system and process memory information. The annotations in the following output from Pstat explain the information reported. (For an explanation of the commit total and limit, see Table 7-8.)
To see the specific usage of paged and nonpaged pool, use the Poolmon utility, described in the experiment.
Finally, the !vm command in the kernel debugger shows the basic memory management information available through the memory-related performance counters. This command can be useful if you're looking at a crash dump or hung system. Here's an example of its output:

EXPERIMENT
Accounting for Physical Memory UseBy combining information available from performance counters with output from kernel debugger commands, you can come close to accounting for physical memory usage on a machine running Windows 2000. To examine the memory usage information available through performance counters, run the Performance tool and add the counters to view the following information. (You'll see the results more easily if you change the vertical scale maximum on the graph to 1000.)
- Total process working set size To view this information, select the Process performance object and the Working Set counter for the _Total process instance. This number will be larger than the actual total process memory utilization because shared pages are counted in each process working set. To get a more accurate picture of process memory utilization, subtract free memory (available bytes), operating system memory used (nonpaged pool, resident paged pool, and resident operating system and driver code), and the size of the modified list from the total physical memory on the machine. What you're left with is the memory being used by processes. Comparing this value against the total process working set size as reported by the Performance tool gives you some indication of the amount of sharing occurring between processes. Although examining process physical memory usage is interesting, of more concern is the private committed virtual memory usage by processes, because memory leaks show up as an increasing private virtual size, not an increasing working set size. (At some point, the memory manager will stop the process from growing in physical size, though it can continue to grow in its virtual size until the commit limit—the maximum amount of private committed virtual memory available on the system—is reached. For more information, see the section "Page Files.")
- Total system working set size To view this information, select the Memory processor object and the Cache Bytes counter. As explained in the section "System Working Set," the total system working set size includes more than just the cache size—it includes resident paged pool and resident operating system and driver code.
- Size of nonpaged pool View this information by adding the Memory: Pool Nonpaged Bytes counter.
- Size of the free, zero, and standby lists View the sizes of these lists by adding the Memory: Available Bytes counter. (Use the !memusage kernel debugger command to get the size of each of the lists separately.)
Your graph or report now contains a representation of all of physical memory except for two components that you can't obtain from a performance counter:
- Nonpaged operating system and driver code
- The modified and modified-no-write paging lists
Although you can easily obtain the size of both the modified and modified-no-write lists by using the kernel debugger !memusage command, there's no easy way to get the size of the nonpaged operating system and driver code. You can, however, get the amount of physical memory being used by nonpaged and paged operating system and device driver code by using the kernel debugger !drivers 1 command and the total of the Resident column. This column represents the number of pages that physically reside in each loaded kernel-mode module.
EAN: 2147483647
Pages: 121