Predicting the Volume of Information to Store and Manage and Predicting Database Utilization
| | ||
| | ||
| | ||
In software construction, you need to estimate the amount of work that the software and hardware will handle. Similar to an engineer who calculates how much weight a bridge needs to support, software developers forecast and analyze the workload that the application must handle. To estimate this workload, developers use prototypes . Prototypes are samples of the software that allow the developer to simulate what the actual version will accomplish.
The process of predicting the volume of information that a server or application will store and manage is called capacity planning . Capacity planning measures, forecasts, analyzes, and sets goals for resource utilization and transaction throughput under load. Capacity planning includes things such as estimates of the number of users, user profiles and usage patterns, server loads, and resource utilization. It also provides hardware recommendations and server configurations for different scenarios. To plan for growth and forecast peak application usage involves extensive performance testing and the measurement of resource utilization and transaction throughput under different loads.
Two methodologies documented by the Microsoft Patterns & Practices Development Center may help you predict the volume of information and database utilization: transaction cost analysis and predictive analysis. Predictive analysis uses historic data. In this book, we will focus on transaction cost analysis.
Using Transaction Cost Analysis
In transaction cost analysis , you calculate the cost of users operations in terms of the resources consumed by the operation. For example, if a user registers a new order, you will estimate how much CPU (central processing unit), memory, and network resources will be consumed by this event.
| More Info | To learn more about transactional cost analysis, read Capacity Model for Internet Transactions at http://www.microsoft.com/technet/archive/mcis/rkcapmit.mspx?mfr=true. |
The following steps help you perform a transaction cost analysis.
Step 1: Compiling a Users Profile
In this step, you will document the transactions that users frequently perform in their daily work. For example, in the order scenario, you may know that, on average, the cashier user opens the application, logs on, opens the register, registers forty-five invoices per hour, voids two invoices per hour , closes the register after four hours, and logs off. This set of tasks is repeated during the day by various shifts.
As shown in the previous example, to compile user profiles requires an understanding of business volumes and application usage patterns. Capture usage scenarios based on the information provided by domain experts.
Step 2: Executing Discrete Tests
In this step, the tasks described in the user profile are performed in an isolated environment (lab or development environment) and captured. To capture and save data about events happening in the server, use Microsoft SQL Server Profiler. As you learned in Chapter 3, SQL Server Profiler is a graphical user interface used to monitor an instance of the SQL Server database engine.
Before capturing the test, perform a full database backup to help you replay the test. To learn how to back up the database, refer to Chapter 3, Disaster Recovery Techniques to Protect Your Database in Microsoft SQL Server 2005: Applied Techniques Step by Step .
Creating the Script
-
Open the SQL Server Profiler by selecting Start Programs Microsoft SQL Server 2005 Performance Tools SQL Server Profiler.
-
Create a new trace by choosing New Trace from the File menu.
-
In the Connect To Server dialog box, log on to the server with an appropriate account.
-
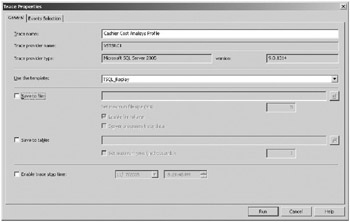
In the Trace Properties dialog box, name the trace and select the TSQL Replay template from the Use The Template drop-down list.
-
Select the Save To File option. The Save As dialog box will appear.
-
In the Save As dialog box, browse to a folder in which to save the file, and click the Save button.
-
In the Trace Properties dialog box, click the Run button.
-
Start the application and complete all of the required operations. Whenever possible, start multiple instances of the application (5-25 instances) to obtain a better sample of the average user.
-
After all operations are finished, stop the trace by using the Stop button on the toolbar in the SQL Server Profiler.
Step 3: Measuring the Cost of Each Operation
Measure the cost of each operation in terms of the resources consumed during the test. To capture resource utilization, you will need to create a Windows performance log.
Creating a Windows Performance Log
-
Open the Performance Monitor by selecting Start Settings Control Panel. Open Administrative Tools, and then double-click the Performance icon.
-
In the left panel under the Console Root folder, expand the Performance Logs And Alerts node and then select the Counter Logs folder.
-
Right-click the Counter Logs folder and select New Log Settings in the context menu.
-
When the New Log Settings dialog box opens, name the log setting and click the OK button.
-
Click the Add Counters button.
-
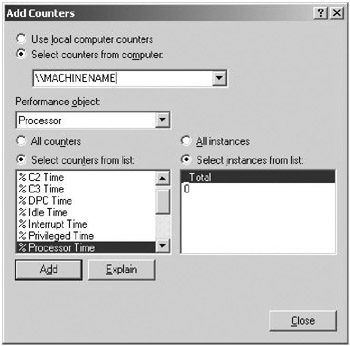
Select an object from the Performance Object drop-down list and select the required counter.
-
Click the Add button.
-
Continue to select objects and add counters.
-
When all required counters are added, click the Close button.
-
On the General tab, select a data sample interval. For transaction cost analysis, use a one-second interval.
-
On the Log Files tab, select the appropriate log type and name. For transaction cost analysis, the default (binary file in the C:\PerfLogs path ) should suffice.
-
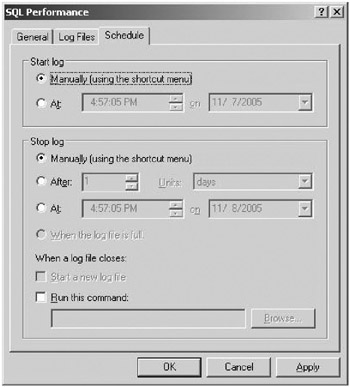
On the Schedule tab, select the appropriate schedule settings. For transaction cost analysis, the best option is to start and stop the log manually.
In SQL Server 2005, the following Windows performance counters shown in Table 4-2 will help you to predict the resource usage.
| Resource | Performance Object | Counter |
|---|---|---|
| Processor | Processor System | Processor Time Processor Queue Length |
| Memory | Memory SQLServerBufferManager | Pages/Sec Buffer Cache Hit Ratio |
| Disk | PhysicalDisk PhysicalDisk | % Disk Time Avg Disk Queue Length |
| Network | Network Interface | Bytes Total/Sec |
To begin capturing information, right-click the log and select Start from the context menu. To finish capturing information, right-click the log and select Stop from the context menu. Capture one log for each operation, or use a single log and keep track of the beginning and end time for each operation.
Based on the number of instances of the application, user operations, and resource usage information, calculate the cost of the average profile in each resource by dividing the resource usage by the number of instances. Use each of the following counters:
-
Processor: Processor Time
-
Memory: Pages/Sec
-
PhysicalDisk: %Disk Time
-
Network Interface: Bytes Total/Sec
Reviewing the Captured Information
-
In the Performance Monitor, select the System Monitor folder.
-
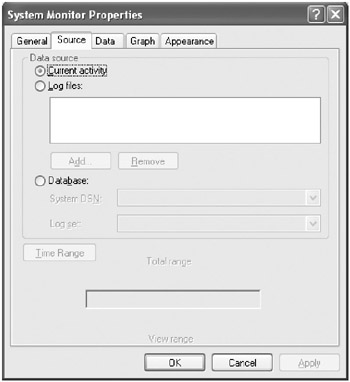
Press the View Log Data button on the toolbar.
-
Select the Log Files option.
-
Click the Add button.
-
Select the trace file and click the Open button.
-
Click OK.
-
Press the Add button on the toolbar.
-
Add the following counters:
-
Processor: Processor Time
-
Memory: Pages/Sec
-
PhysicalDisk: % Disk Time
-
Network Interface: Bytes Total/Sec
-
-
Close the Add Counter dialog box.
As an example, you may have the following metrics in the register invoice task of the cashier profile as shown in Table 4-3.
| Resource | Resource Usage | Average User |
|---|---|---|
| Processor | 15% | 0.75% |
| Memory | 5 Pages/Sec | 0.25 |
| Disk | 3% | 0.15% |
| Network | 1530 Bytes/Sec | 76.75 |
The other counters (System: Processor Queue Length, SQLServerBufferManager: Buffer Cache Hit Ratio, and Physical Disk:Avg Disk Queue Length) indicate when the resource is becoming a system bottleneck. A bottleneck is any resource, component, or activity that limits performance.
If the counters are consistently above the following threshold, the resource must be considered a bottleneck and will considerably affect the performance of the application. To have small bursts of the counter over the threshold is expected. Only when the resources counter value is consistently above the threshold is the resource considered to be a bottleneck (refer to Table 4-4).
| Counter | Threshold | Resource |
|---|---|---|
| Buffer Cache Hit Ratio | <90% | Memory |
| Processor Queue Length | >2 | Processor |
| Avg Disk Queue Length | >2 | Disk |
When a bottleneck is reached, not only is performance greatly reduced, but the rest of the counters also change dramatically. For example, assume that the Buffer Cache Hit Ratio indicates a memory bottleneck because the register invoice task produces a persistent 70 percent value. Because memory is scarce , the Windows operating system will likely start swapping pages (saving memory to hard disk in a virtual memory file). This will not only increase the memory counter, but also the disk counter.
Step 4: Calculating the Cost of an Average Profile
Based on the information captured and your understanding of the business volumes and application usage patterns, estimate the average profile by estimating the average resource cost of the profile at the peak usage.
Table 4-5 demonstrates the input and results of the average profile user calculations. In this example, the Logon value (2.5%) would be chosen as the processor resource because experience suggests that most cashiers will log on at the same time. The memory resource would use a weighted average of register and void invoices based on your user profile, in this case (45*.025+2*1.25)/47. The disk and network resources would use a weighted average of register invoice (70%) and close register (30%) because experience indicates that no more than 30 percent of cashiers close simultaneously .
| Resource | Logon | Register Invoice | Void Invoice | Close Register | Average Profile |
|---|---|---|---|---|---|
| Processor | 2.50% | 0.75% | 0.90% | 3.50% | 2.50% |
| Memory | 0.02 | 0.25 | 1.25 | 0.25 | 0.29 |
| Disk | 0.06% | 0.15% | 0.30% | 6.28% | 1.99% |
| Network | 1776.75 | 76.75 | 125.45 | 5476.75 | 1696.75 |
Step 5 : Calculating the Maximum Capacity
With the information collected in the previous step, estimate the maximum server capacity. To calculate this capacity, divide the maximum server capacity between the average profile cost. If you assume that the server will only support cashiers, you may estimate the following maximum capacity as shown in Table 4-6.
| Resource | Average Profile | Maximum Capacity | Maximum # of Users |
|---|---|---|---|
| Processor | 2.50% | 100% | 40 |
| Memory | 0.29 | 200 | 689 |
| Disk | 1.99% | 100% | 50 |
| Network | 1697 | 500,000 | 294 |
| Server Maximum Capacity | 40 |
Based on the previous example, the maximum number of users that the server supports will be forty users. Select the least of the maximum number of users supported by each resource. When multiple profiles are estimated, create a weighted average of all users and use that as the average profile.
Step 6: Verifying the Maximum Capacity
After making the needed calculations, you may verify the maximum capacity of the server by using the scripts captured with the SQL Server Profiler or other testing tools.
| | ||
| | ||
| | ||
EAN: N/A
Pages: 130