Using SQL Server Profiler
| | ||
| | ||
| | ||
SQL Server Profiler is a tool that captures events that occur in the SQL Server 2005 server. This feature allows you to know exactly what is contained in all of the sentences that your applications send to the server. This section will help you to:
-
Understand how the tool works.
-
Define traces and capture events.
-
Understand the different types of events that can be captured.
-
Cross-check traces with Performance Monitor.
| More Info | SQL Server Profiler is also discussed in Chapter 4, Gathering and Understanding Business Requirements before Creating Database Objects. |
Using the SQL Server Profiler Tool and Creating a Trace
SQL Server Profiler contains two parts : one is a client application and the other is part of the server.
-
The client application is a graphical user interface (GUI) that helps you create traces, use templates, configure the tool based on templates, select columns and events to be audited , and file and trace schedules.
-
The server part is the kernel of SQL Server Profiler. It listens for the events subscribed to by the GUI or by other traces. Any trace definition uses some system stored procedures to configure the trace in the server side of the SQL Server Profiler. The server component will synchronize with the client application to bring it the information audited by the trace.
Creating a Trace with the GUI
-
From the Start menu, choose All Programs Microsoft SQL Server 2005 Performance Tools SQL Server Profiler.
-
Once the application is running, select New Trace from the File menu.
-
Connect to your SQL Server instance. You will see a screen resembling the following image.
-
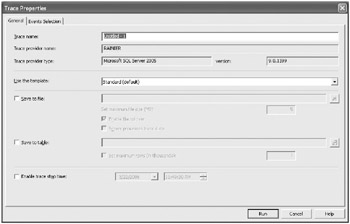
Besides generic information about the trace, such as the name , template, and SQL Server instance, you can configure other SQL Server Profiler trace general properties in the Trace Properties dialog box.
-
To save the trace into a file (with a .trc extension):
-
4.1. Select the Save To File option in the Trace Properties dialog box.
-
4.2. Choose the files location and name.
-
4.3. Once you have specified the file location and name, you can edit other options in the Trace Properties dialog box:
-
Maximum size for the trace
-
Enable File RolloverAllows the Profiler to re-create the file when it reaches the maximum size
-
Server Processes Trace DataIndicates whether the server is responsible for saving the trace data. If you do not configure this option, the client application must save the data.
-
-
-
To save the trace in a SQL Server data table instead of a file:
-
5.1. Select the Save To Table option.
-
5.2. Connect to the desired SQL Server instance.
-
5.3. Choose both the database and the table in which to save the information.
-
5.4. Once you have specified the database and table, you can specify a maximum number of rows to which the table can grow.
-
-
Regardless of whether and where you save your trace, you can select the Enable Trace Stop Time option, which allows you to choose precisely the time to stop the trace.
Tip We do not recommend saving the trace either in a file or a data table, for this uses more resources and jeopardizes the measurements.
-
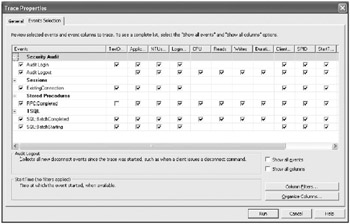
On the Trace Events tab of the Trace Properties dialog box, you can specify which events you want to audit, which columns will be registered, and which filters will be applied.
-
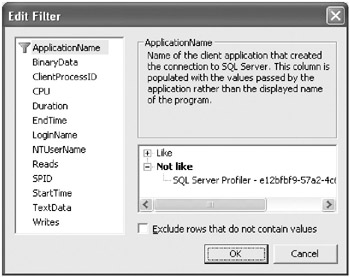
To define filters, click the Column Filters button. A new window will appear in which you can apply filters to every audited column.
Note In SQL Profiler for SQL Server 2000, it was a complex process to determine which columns retrieved information in which events. In the SQL Server 2005 version, columns and events appear in a matrix where you can easily identify them. For that reason, it is recommended that you also use SQL Server Profiler 2005 with SQL Server 2000.
-
When the trace has been properly configured, click the Run button in the Trace Properties dialog box to begin capturing the events. SQL Server Profiler will show you each event sequentially.
When Should You Use SQL Server Profiler?
SQL Server Profiler is useful for:
-
Analyzing how applications use the SQL Server instance.
-
Detecting which stored procedures are used most often, which means obtaining a standard initial utilization point benchmark.
-
Debugging stored procedures and T-SQL sentences. You can evaluate values, such as reads, writes , and central processing unit utilization, for each operation that a stored procedure or T-SQL sentence performs .
-
Recording the trace for specific processes to optimize their design and replaying the trace once the processes are modified.
-
Analyzing queries by storing the query plan in traces.
-
Analyzing the performance of the database engine, Analysis Services, and the security audit of Integration Services.
-
Locating deadlocks graphically.
Accessing Event Types
SQL Server Profiler events are grouped into event categories such as Broker, Security Audit, Performance, Cursors, and Locks. Each of these categories includes a set of event classes to obtain information about the specific events. Depending on their nature and style, you must select the information to capture in each event class by using the corresponding data columns.
Selecting Data in Event Classes
-
In SQL Server Profiler, stop the trace if it is running by choosing Stop Trace from the File menu. It is not possible to modify event class selections while the trace is running.
-
Choose Properties from the File menu, or click the Properties toolbar button.
-
Select the Events Selection tab. Note that only the selected event classes and columns are displayed by default. Check the Show All Events and Show All Columns checkboxes.
-
Navigate through the events columns, and check the event classes and related columns of your choice. You can change the order of displayed columns by clicking the Organize Columns button.
-
Click the Run button to start the SQL Server Profiler trace with the new event selection.
Running SQL Server Profiler and Performance Monitor Together
One of the new SQL Server Profiler features is the ability to run Performance Monitor and SQL Server Profiler side by side. This option provides you with detailed information about performance counters related to SQL Server activity. To run SQL Server Profiler and Performance Monitor side by side, perform the following steps.
Running SQL Server Profiler and Performance Monitor Side by Side
-
Start Performance Monitor by choosing Performance Monitor from the Tools menu in SQL Server Profiler. Alternatively, from the Start menu, choose All Programs Control Panel. Double-click the Administrative Tools icon and then double-click the Performance icon.
-
Expand the Performance Logs And Alerts node in the Console Root tree and select Counter Logs to create a new counter log.
-
Right-click the Details pane (to the right of the tree pane) and select New Log Settings from the context menu. In the Name textbox, type TestLog and click OK.
-
Click the Add Objects button and add the following objects (select them in the list and click the Add button):
-
Memory
-
Processor
-
SQLServer:Databases
-
SQLServer:General Statistics
Click the Close button to close the Add Objects dialog box.
-
-
Click OK. If the Perflog folder is not yet created, you will receive a warning message. Accept it. The counter log will start automatically.
-
Switch to SQL Server Profiler and create a new trace.
-
In the Trace Name textbox, type TestTrace .
-
Click the Save To File checkbox, and navigate to the C:\Perflogs folder to store the trace.
-
Click the Run button.
To generate some activity, in SQL Server Management Studio, open the \Ch03\TestTrace.sql file included in the sample files and execute it while the counter log and trace are running. Wait until the script ends, which will take a few minutes.
-
Switch to SQL Server Profiler and stop the trace. Close the trace.
-
Switch to Performance Monitor and stop the counter log by right-clicking it in the Details pane and choosing Stop from the context menu.
-
Switch back to SQL Server Profiler. From the File menu, choose Open Trace File. Navigate to C:\Perflogs and choose the TestTrace.trc file.
-
From the File menu, choose Import Performance Data. Navigate to C:\Perflogs and select the TestLog_000001.blg file. The Performance Counters Limit dialog box appears. Select the following counters:
-
Expand the Memory node and select Pages\Sec.
-
Expand the Processor node and select % Processor Time.
-
Select the SQLServer:Databases node.
-
Select the SQLServer:General Statistics node.
-
-
You will be informed that you have selected too many Performance Monitor counters. Click Yes to the warning message, and then click OK.
You can now view SQL Server Profiler and Performance Monitor data side by side. Note that both data are synchronized; therefore, if you select a trace event, a cursor will be positioned in the performance graphic at the location of that event.
Viewing Deadlocks in SQL Server Profiler
Another new feature of SQL Server Profiler is the ability to view deadlocks graphically. In addition, you can export deadlock information to an .xml file to analyze the deadlock in SQL Server Management Studio. To do so, complete the following steps.
Exporting Deadlock Information
-
Start SQL Server Profiler from the Start menu by choosing All Programs Microsoft SQL Server 2005 Performance Tools SQL Server Profiler.
-
Choose File New Trace and connect to your server. In the Events Selection tab of the Trace Properties dialog box, select the Show All Events checkbox. Expand the Locks event category and select the following event classes: Deadlock Graph, Lock:Deadlock, and Lock:Deadlock Chain.
-
Click the Run button.
-
In SQL Server Management Studio, open \Ch03\Deadlock1.sql and \Ch03\Deadlock2.sql.
-
Execute both scripts. These scripts will produce a deadlock. When the deadlock is detected , switch to SQL Server Profiler.
-
Stop the trace.
-
In the EventClass column, locate the Deadlock Graph event class.
The deadlock is displayed graphically in the Details pane. If you move your mouse over the image of the processes, you will see a Tool Tip with the associated T-SQL sentence.
-
Right-click the Deadlock Graph event class and choose Extract Event Data from the context menu.
-
Navigate to \Ch03 and save the deadlock as deadlock.xdl .
-
Open Windows Explorer and navigate to \Ch03.
-
Double-click deadlock.xdl. SQL Server Management Studio will open the deadlock file.
| | ||
| | ||
| | ||
EAN: N/A
Pages: 130