Section 10.8. Debugging
10.8. DebuggingCasually speaking, debugging can be defined as the process of finding and fixing defects, or bugs,[15] in an object of interest, which could be a piece of software, firmware, or hardware. In this section, we will look at several areas related to kernel debugging.
10.8.1. Kernel PanicsWhen there is a kernel panic, the kernel takes different actions depending on whether kernel debugging is enabled or not. By default, kernel debugging is disabled, in which case the kernel displays a panic user interface that instructs the user to restart the computer. We saw in Section 5.6 how to customize and test this user interface. Various kernel-debugging options can be enabled by setting the appropriate bits in the kernel's debug boot-time argument. Table 413 lists details of this argument. A typical setting of debug is 0x144, which is the bitwise OR of DB_LOG_PI_SCRN (disables the panic user interface), DB_ARP (allows the kernel debugger nub to use ARP), and DB_NMI (enables support for NMI generation). With this setting, the kernel dumps kernel panic information on the screen and waits for a debugger connection. Figure 1039 shows an example of a kernel panic dump, along with the functions involved in generating the dump. The panic corresponds to a NULL pointer being dereferenced in the kernel. Figure 1039. Dissection of a kernel panic dump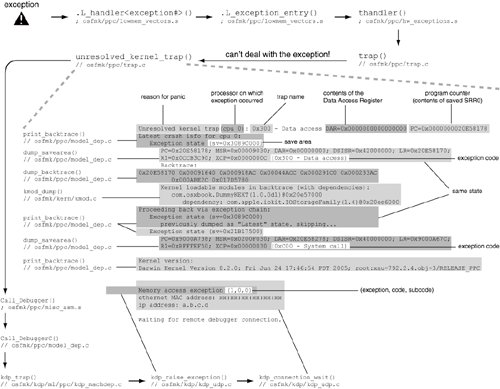
The file osfmk/kern/debug.c contains definitions of several panic-related data structures and variables, such as panicstr, panic_lock, paniccpu, panicDebugging, debug_mode, logPanicDataToScreen, and debug_buf. It also implements the platform-independent panic() routine, which calls the platform-dependent routine Debugger() [osfmk/ppc/model_dep.c]. As we saw in Section 4.11.1.1, if kernel debugging is disabled, information about the last kernel panicif there was oneis saved in a special NVRAM partition, provided there is sufficient space in the NVRAM. The panic information represents the contents of the debug_buf global buffer. Even though a page of memory is allocated for the latter, only up to 2040 bytes of its contents are saved to NVRAM,[16] or transmitted to another computer, by Debugger(). On rebooting, the contents of the panic log are available as an NVRAM property called aapl,panic-info, which is read-only from the user's standpoint. The property is created when Open Firmware variables are initialized in the IONVRAM module [iokit/Kernel/IONVRAM.cpp]. Additionally, the NVRAM panic partition is marked for clearing.
Once the kernel panics, a driver cannot automatically reboot the system because the kernel does not run driver threads after a panic. However, the Xserve hardware watchdog timer can be used to trigger a reboot. During bootstrapping, the crash reporter daemon (/usr/libexec/crashreporterd) is launched by the CrashReporter startup item. crashreporterd calls a helper tool (/usr/libexec/crashdump) to read the contents of aapl,panic-info and dump them to the panic log file (/Library/Logs/panic.log). The raw contents can also be viewed using the nvram command-line program: $ nvram -p aapl,panic-info aapl,panic-info %e1%87v%9cj1%f0%ea%81%82%0cxvl%cb%c9%03%0f...Note that the contents of aapl,panic-info are the same as what would have been displayed on-screen if kernel-debugging were enabled.
On Old World Macintosh computers, the NVRAM may not have enough space to store the panic information. On such computers, no panic log will be dumped on rebooting after a panic. 10.8.2. Remote Core DumpsThe Mac OS X kernel supports remote core dumping wherein one Mac OS X system can send core dumps to another system, with the latter running the remote kernel core dump server (/usr/libexec/kdumpd)also called the panic server. kdumpd is derived from the BSD tftp program.[17] It listens on UDP port number 1069, which is hardcoded in the implementation of the Kernel Debugging Protocol (KDP). It should be executed as a low-privilege user such as "nobody." The directory for storing received core files is specified to kdumpd as an argument.
A single panic server can receive core dump files and panic logs from multiple systems. The core dump filename sent by a target kernel uses the string "core-<kernel-version>-<ip>-<abstime>" as the template, where <ip> is the IP address of the sender in dotted-decimal format and <abstime> is the hexadecimal representation of the lower 32 bits of the absolute time value (as reported by mach_absolute_time()). Note that the kernel can send both core dump files and panic logs to kdumpd. The following is an example of the message printed by a target machine while sending a core dump file to kdumpd: Entering system dump routine Attempting connection to panic server configured at IP 10.0.0.1 Routing via router MAC address xx:xx:xx:xx:xx:xx Kernel map size is 725536768 Sending write request for core-xnu-792-10.0.0.2-4104e078 To enable sending core dumps to a panic server, the latter's IP address is specified through the _panicd_ip boot-time argument to the target kernel. Moreover, the appropriate bits of the debug argument must be setin particular, the DB_KERN_DUMP_ON_PANIC (0x400) bit must be set to trigger a core dump on panic. Additionally, DB_KERN_DUMP_ON_NMI (0x800) can be set to trigger a core dump on an NMI without inducing a kernel panic. $ sudo nvram boot-args="-v debug=0xd44 panicd_ip=10.0.0.1"There are certain caveats in transmitting core dumps to the panic server, such as the following.
10.8.3. LoggingLogging is an integral part of software debugging, whether it is kernel-level or user-level software. The Mac OS X kernel provides several mechanisms that kernel extensions can use to log messages. The Mac OS X system log facility, Apple System Logger (ASL), supports several methods of dispatching log messages. Figure 1040 shows an overview of logging in Mac OS X. Figure 1040. Logging in Mac OS X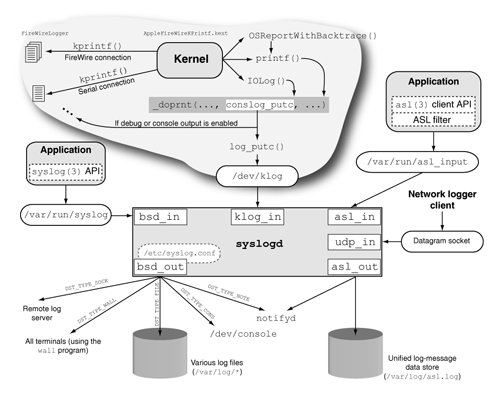 The following are the primary logging functions available in the kernel.
conslog_putc() [osfmk/kern/printf.c] calls log_putc() [bsd/kern/subr_log.c] to append messages to a global message buffera msgbuf structure that we came across in Section 5.3.3. // bsd/sys/msgbuf.h #define MSG_BSIZE (4096 - 3 * sizeof(long)) struct msgbuf { #define MSG_MAGIC 0x063061 long msg_magic; long msg_bufx; // write pointer long msg_bufr; // read pointer char msg_bufc[MSG_BSIZE]; // circular buffer }; The user-space system log daemon (/usr/sbin/syslogd) retrieves log messages from the kernel by reading from the kernel log device /dev/klog. During file system initialization, the device file system layer (devfs) is initialized. As part of devfs initialization, several built-in BSD-style devices, including /dev/klog, are initialized. The device-switch structure (struct cdevsw) of /dev/klog contains logopen(), logread(), and logselect() [bsd/kern/subr_log.c] as the open, read, and select functions, respectively. syslogd uses the select() system call to see if the log device is ready for reading. As shown in Figure 1041, the kernel periodically wakes up the thread waiting on the log device by calling klogwakeup(). Figure 1041. Periodic delivery of log messages to readers of the log device
The logopen() function ensures that only one thread can open the log device at a time. 10.8.4. Debugging by Using GDBAs we discussed in Section 6.8.1, Mac OS X supports two-machine kernel debugging using GDB over an Ethernet or FireWire connection. Consider the case of Ethernet-based debugging. We saw earlier that a network driver that supports such debugging provides polled-mode implementations of functions to transmit and receive packetssendPacket() and receivePacket(), respectively. The IONetworkController class provides the attachDebuggerClient() method to allocate an IOKernelDebugger object and attach it as a client, leading to the creation of a debugger client nub. The IOKernelDebugger instance calls a KDP-layer functionkdp_register_send_receive() [osfmk/kdp/kdp_udp.c]to register internal transmit and receive dispatcher functions, which in turn call the polled-mode methods when the debugger is active. Thereafter, the KDP module can send and receive protocol packets. Figure 1042 shows a portion of the I/O Kit stack relevant to Ethernet- and FireWire-based debugging. Figure 1042. Objects that implement target-side KDP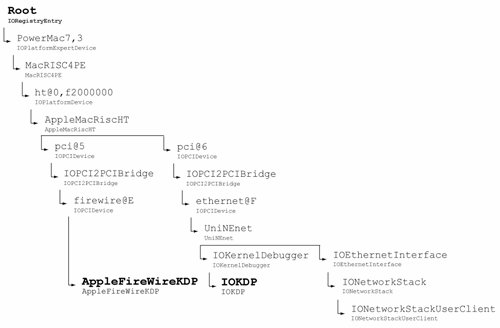
A network controller can have at most one debugger client. Apple provides a package called Kernel Debug Kit that contains debug versions of the Mac OS X kernel and several I/O Kit family kernel extensions. The executables in this kit are meant for remote debugging using GDBthey contain full symbolic information. Note, however, that the kernel contained in the kit is a release kernelthat is, it is compiled in the RELEASE_xxx configuration, rather than the DEBUG_xxx configuration. There are several ways to cause a kernel to stop normal execution and wait for a remote GDB connection. A kernel panic is one, but it is possible to invoke the debugger by generating an NMI and even by calling a function. As listed in Table 413, the debug boot-time argument can be set to the following values to cause the kernel to wait for debugger connection on an NMI:
You can programmatically enter the debugger from a kernel extension by calling the PE_enter_debugger() function. One approach to performing two-machine debugging of an I/O Kit driver involves calling PE_enter_debugger() from the driver's start method. The driver is loadedbut not startedby calling kextload with the -l option. The -s option is specified to generate the symbol files for the driver and its dependencies. These are then available to the debugging machine. Thereafter, matching can be initiated for the driver by calling kextload with the -m option, which this will cause the target kernel to wait for a remote debugger connection. The debugging machine can then attach to it. Let us modify our DummyDriver example by adding a call to PE_enter_debugger("Entering Debugger") in its start method. Recall that the OSBundleLibraries key of the driver lists com.apple.kernel.iokit as a dependency. $ sudo kextload -s /tmp -vl /tmp/DummyDriver.kext kextload: extension DummyDriver.kext appears to be valid kextload: notice: extension DummyDriver.kext has debug properties set kextload: loading extension DummyDriver.kext kextload: writing symbol file /tmp/com.apple.kernel.iokit.sym kextload: writing symbol file /tmp/com.osxbook.driver.DummyDriver.sym kextload: DummyDriver.kext loaded successfullyThe driver is now loaded but not started. After transferring the symbol files to the debugging machine, we can start the loaded driver: $ sudo kextload -m DummyDriver.kextIf the panic user interface is disabled, the target machine will display a text message. Let us assume that the target machine's IP address and Ethernet address are 10.0.0.2 and aa:bb:cc:dd:ee:ff, respectively. Debugger(DummyDriver: we are entering the debugger) ethernet MAC address: aa:bb:cc:dd:ee:ff ip address: 10.0.0.2 Waiting for remote debugger connection. Now we can prepare and launch the debugger from the debugging machine. $ sudo arp -s 10.0.0.2 aa:bb:cc:dd:ee:ff $ gdb /path/to/copy/of/target/machines/mach_kernel ... (gdb) source /path/to/kgmacros Loading Kernel GDB Macros Package. Try "help kgm" for more info. (gdb) add-symbol-file /tmp/com.osxbook.driver.DummyDriver.sym add symbol table from ...? (y or n) y Reading symbols from ... done. ... (gdb) target remote-kdp (gdb) attach 10.0.0.2 Connected. [switching to process 3] ... (gdb) where ... (gdb) continue 10.8.5. Debugging by Using KDBAs we discussed in Section 6.8.2, the Mac OS X kernel also supports a built-in kernel debugger called KDB, which is more suitable for low-level kernel debugging. In some cases, KDB may be the only kernel-debugging optionsay, if you need to debug a kernel component before an Ethernet or FireWire connection can be operational. KDB requires a native serial portsuch as the one in an Xservethat the kernel can operate by polling, without requiring additional drivers. In particular, PCI- or USB-based serial port adapters will not work with KDB. Unlike the KDP shim for Ethernet debugging, KDB support is not compiled into the default kernel. It is also not available as a loadable kernel extension as in the case of FireWire-based debugging. To use KDB, the kernel must be compiled in the debug configuration. $ cd /path/to/xnu/source $ make exporthdrs && KERNEL_CONFIGS=DEBUG all ... $ ls BUILD/obj/DEBUG_PPC/mach_kernel mach_kernel ... $ sudo cp BUILD/obj/DEBUG_PPC/mach_kernel /mach_kernel.debug $ sudo chown root:wheel /mach_kernel.debug $ sudo chmod 644 /mach_kernel.debug A convenient way to boot an alternate kernel is to set the boot-file Open Firmware variable appropriately. $ mount ... /dev/disk0s3 on / (local, journaled) $ ls /mach_kernel* /mach_kernel /mach_kernel.debug $ nvram boot-file boot-file $ sudo nvram boot-file='hd:3,mach_kernel.debug' Moreover, the DB_KDB (0x10) bit must be set in the debug boot-time argument to use KDB as the default debugger, for example: $ sudo nvram boot-args="-v debug=0x11c"The value 0x11c is the logical OR of DB_NMI, DB_KPRT, DB_KDB, and DB_LOG_PI_SCRN. Let us look at a sample KDB session to get a flavor of its functionality. Figure 1043 shows how the two machines involved are connected. The debugging machine has a USB-to-serial adapter, through which it connects to the native serial port of an Xserve, which is the target machine. We assume that /dev/tty.usb is the serial terminal device node created by the adapter's driver. We use the minicom serial communications program, but in general, any such program can be used. Figure 1043. A KDB setup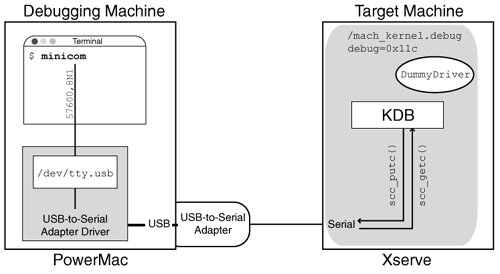 Tables 102, 103, and 104 list most of the commands available in KDB. Several commands take one or more arguments, as well as optional modifiers that are specified using the slash character. Assuming that our DummyDriver kernel extension called PE_enter_debugger("Hello, KDB!"), a KDB session would be initiated as follows: ... kmod_create: com.osxbook.driver.DummyDriver (id 100), 2 pages loaded at 0x0 Matching service count = 1 ... init attach com_osxbook_driver_DummyDriver::probe(IOResources) probe detach com_osxbook_driver_DummyDriver::start(IOResources) <1> attach start Debugger(Hello, KDB!) Stopped at _Debugger+228: tweq r3,r3 db{0}>
Thereafter, KDB commands are entered at the db prompt. As shown in Table 102, KDB provides commands that act on specific kernel objects and addresses, as well as commands that act globallysay, on all tasks. db{0}> dc 0x5000 # the address 0x5000 (PowerPC) contains the characters "Hagfish " 0000000000005000 Hagf ish .... .... .9.. .... .... .6.$ 0000000000005020 .... .... .... .... .... .... .... .... ... db{0}> search /l 0x5000 0x48616765 # search for "Hage" no memory is assigned to src address 0000c000 db{0}> search /l 0x5000 0x48616766 # search for "Hagf" 0x5000:KDB commands are especially suited for examining Mach data structures. db{0}> show task # show current task 0 (01BCCD58): 41 threads: 0 (003C2638) W N (_vm_pageout_continue) _vm_page_free_wanted 1 (01BD691C) R (_idle_thread) 2 (01BD6588) W N (_sched_tick_continue) _sched_tick_thread ... 39 (0280FACC) W N _clock_delay_until 40 (028941F4) R db{0}> show vmtask # show VM information for current task id task map pmap virtual rss pg rss mem wir pg wir mem 0 01bccd58 00e3fe50 003a1000 796236K 14857 59428K 0 0K db{0}> show map 0xe3fe50 # show details of VM map task map 00E3FE50 prev = 00F862A8 next = 00F98FD4 start = 0000000000001000 end = 00000000DFF0 nentries = 00000588, !entries_pageable ...KDB commands are also useful for viewing system-wide information and statistics. db{0}> show runq # show run queue information PROCESSOR SET 41b800 PRI TASK.ACTIVATION 63: 41.1 44.4 31: 5.0 db{0}> dk # show information about kernel extensions info addr start - end name ver ... 2F739E44 2F738000 2F739000 - 2F73A000: com.osxbook.driver.DummyDriver, 11 ... 01BC1780 00000000 00000000 - 00000000: com.apple.kpi.bsd, 8.2.0 01BC1890 00000000 00000000 - 00000000: com.apple.kernel, 8.2.0 db{0}> show system # show scheduling and VM statistics Scheduling Statistics: Thread invocations: csw 115458 same 7585 Thread block: calls 202781 Idle thread: handoff 146906 block 0 no_dispatch 0 Sched thread blocks: 0 VM Statistics: pages: activ 13344 inact 21024 free 210689 wire 17087 gobbl 0 target: min 2569 inact 586 free 3190 resrv 98 pause: Pageout Statistics: active 0 inactv 0 nolock 0 avoid 0 busy 0 absent 0 used 0 clean 0 dirty 0 laundry_pages_freed 010.8.6. Miscellaneous Debugging ToolsMac OS X provides several programs such as the following that are useful while analyzing, profiling, or debugging kernel extensions.
10.8.7. StabsMac OS X uses the GNU C compiler (GCC) suite for compiling C, C++, and Objective-C source. When the compiler is passed the -g option, it produces additional debugging information in the Mach-O output. This debugging information can then be used by both KDB and GDB. By default, the popular stabs format is used on Mac OS X to represent information that describes a program to a debugger. Originally used for the pdx Pascal debugger, stabs began as a set of special symbols within an "a.out" executable. It has since been adopted widely and has been encapsulated into several other file formats. The word stabs is derived from symbol table. Stabs describe various features of the program source, such as source filenames and line numbers, function names, function parameters, variable types, and variable scopes. The information is emitted through a set of assembler directives called stab directives (or simply stabs). The assembler uses the stabs information while populating the symbol table and the string table of object files. The linker consolidates one or more object files into a final executable. Thereafter, a debugger can examine the stabs in the executable to glean debugging information. Consider a simple C function such as the one shown in Figure 1044. Figure 1044. A simple C function
Let us compile the function shown in Figure 1044 first without any debugging options and then with debugging turned on. We will save the intermediate assembly output for the latter compilation so that we can examine the stabs encodings generated. $ gcc -Wall -c -o func_nondebug.o func.c $ gcc -Wall -g -c -o func_debug.o func.c $ gcc -Wall -g -S -o func_debug.s func.c $ ls func* func.c func_debug.o func_debug.s func_nondebug.o Let us use nm to display the symbol tables of the object files obtained. Note that we will use nm with the -a option, which displays all symbol table entries, including those inserted for use by debuggers. $ nm -a func_nondebug.o 00000000 T _funcWe see that the nondebug version of the object file has only one symbol: _func. This makes sense, since func.c contains only one function, func(), which does not call any external functions. $ nm -a func_debug.o 00000044 - 01 0000 RBRAC 00000000 - 01 0000 LBRAC 00000044 - 01 0000 SO 00000000 - 01 0000 BNSYM 00000000 - 01 0004 SLINE 00000014 - 01 0008 SLINE 00000024 - 01 0009 SLINE 00000030 - 01 000b SLINE 00000034 - 01 000c SLINE 00000044 - 01 0000 ENSYM 00000044 - 00 0000 FUN 00000000 - 01 0002 SO /tmp/ 00000000 T _func 00000000 - 01 0002 SO func.c 00000000 - 01 0004 FUN func:F(0,1) 00000000 - 00 0000 OPT gcc2_compiled. 00000000 - 00 0000 LSYM int:t(0,2)=r(0,2);-2147483648;2147483647; 00000018 - 00 0006 LSYM negative:(0,2) 0000001c - 00 0005 LSYM sum:(0,1) 00000000 - 00 0000 LSYM unsigned int:t(0,1)=r(0,1);0;037777777777; 00000058 - 00 0003 PSYM x:p(0,1) 0000005c - 00 0003 PSYM y:p(0,1)In contrast, the debug version of the object file has several other symbols besides _func. These additional symbols are stabs that encode the program's structure. Let us look at the assembly file (func_debug.s) corresponding to the debug compilation and analyze the stabs to understand their purpose. Figure 1045 shows the assembly file's contents, with the stabs information highlighted. Figure 1045. Stabs-encoded debugging information in an assembly file
As Figure 1045 shows, stabs assembler directives generated by GCC fall in three main classes on Mac OS X: .stabs (string), .stabn (number), and .stabd (dot). These classes have the following formats: .stabs "string",type,other,desc,value .stabn type,other,desc,value .stabd type,other,desc For each class, the type field contains a number that provides basic information about the stab type. If the number does not correspond to a valid stab type, the symbol is not treated as a stab. The other fields in a stab are interpreted based on the stab type. For example, the string field of the .stabs directive has the format "name:symbol-descriptor type-information", where the fields have the following meanings.
A new type definition may refer to previously defined types by number. Whereas the type number is a single number on some implementations, it is a (file-number, filetype-number) pair on others, including Mac OS X. A file-number value starts from 0 and is incremented for each distinct source file in the compilation. A filetype-number value starts from 1 and is incremented for each distinct type in that file. In the example shown in Figure 1045, we see the following stab types (in the order that they appear): 100, 60, 46, 68, 36, 128, 160, 192, 224, and 78. Table 105 shows the meanings of these symbols. Note that a given programming language may have certain stab types specific to it.
Let us analyze some of the stab directives to understand how the scheme works. .stabs "/tmp/",100,0,2,Ltext0 .stabs "func.c",100,0,2,Ltext0 Stab type 100 (N_SO) specifies the paths and names of source files. The symbol's value in this caseLtext0represents the start address of the text section that comes from the given file. .stabs "gcc2_compiled.",60,0,0,0 Stab type 60 (N_OPT) specifies debugger options. In this case, "gcc2_compiled" is defined to allow GDB to detect that GCC compiled this file. .stabd 68,0,4 ... .stabd 68,0,8 ... .stabd 68,0,9 ... .stabd 68,0,11 ... .stabd 68,0,12 Stab type 68 (N_SLINE) represents the start of a source line. In this case, we have stabs for line numbers 4, 8, 9, 11, and 12the other line numbers in func.c do not contain active code. .stabs "unsigned int:t(0,1)=r(0,1);0;037777777777;",128,0,0,0 ... .stabs "int:t(0,2)=r(0,2);-2147483648;2147483647;",128,0,0,0 Stab type 128 (N_LSYM) is used both for variables allocated on the stack and for giving names to types. In this case, the stab names the C type unsigned int. The t symbol descriptor is followed by the type number (0,1), thus associating unsigned int with type number (0,1). The r type descriptor defines a type as a subrange of another type. Here, it (circularly) defines (0,1) as a subrange of (0,1), with the lower and upper bounds being 0 and the octal number 0037777777777 (that is, 0xFFFF_FFFF), respectively. Similarly, the type (0,2)the second type number in the filerepresents the C type int, with upper and lower bounds being 2147483647 (231) and -2147483648 (231), respectively. .stabs "func:F(0,1)=r(0,1);0000000000000;0037777777777;",36,0,4,_func Stab type 36 (N_FUN) describes a function. In this example, the function's name is func. The F symbol descriptor identifies it as a global function. The type information that follows F represents the return type of the function(0,1), or unsigned int, in this case. The stab's value_funcspecifies the start of the function. Note that the stab describing a function immediately follows the function's code. .stabs "x:p(0,1)",160,0,3,88 .stabs "y:p(0,1)",160,0,3,92 Stab type 160 (N_PSYM) is used to represent the formal parameters of a function. The p symbol descriptor specifies a parameter passed on the stack. Recall from our discussion of C calling conventions for the PowerPC in Chapter 3 that even though the first few arguments are normally passed in registers, there is always space reserved for them in the caller's stack, where the callee saves them after it is called. In this example, we have two parameters named x and y. The type number following p(0,1)denotes the parameter's type. The desc field is 3 for both x and y, indicating that the parameters are on source line number 3. The value field, which is 88 and 92 for x and y, respectively, represents the offset (from the frame pointer) used to locate the parameter. .stabs "sum:(0,1)",128,0,5,32 This stab corresponds to the variable named sum, whose type is (0,1). The variable is at source line number 5. Its offset from the frame pointer is 32 bytes. .stabn 192,0,0,_func .stabn 224,0,0,Lscope0 Stab types 192 (N_LBRAC) and 224 (N_RBRAC) correspond to the left and right brace, respectivelythey represent the program's block structure. The value fields refer to assembly labels surrounding the scope that is described by the N_LBRAC/N_RBRAC pair. .stabs "",36,0,0,Lscope0-_func This is an N_FUN stab with an empty string as the function name and Lscope0-_func as its value. The purpose of such a stab is to indicate the address of the end of a function. In this case, the stab marks the end of _func. .stabs "",100,0,0,Letext0 This is an N_SO stab with an empty string as the filename and Lextext0 as the value. Similar in purpose to an N_FUN stab with an empty string, this stab marks the end of the source file. |
EAN: 2147483647
Pages: 161