| As we mentioned earlier, logic errors are problems with your program's logic. They are often hard to track because the program doesn't stop working, it just produces incorrect results. To help track down these bugs in your program, Visual Basic provides several tools: Breakpoints allow you to have VB stop on a certain line of code. You can then trace the code forward from the breakpoint a line at a time. The Immediate window provides a way to execute statements (such as changing a variable's value or calling methods) while your program is in debug mode. The Output window provides a way to dump debug information to the screen, such as variable values. Watches provide a way to keep track of the values of objects or variables during a program's execution.
In this chapter we will look at the basics of debugging your programs. To learn even more, see Chapter 26, "Debugging and Performance Tuning."  For more on debugging, p.717 For more on debugging, p.717
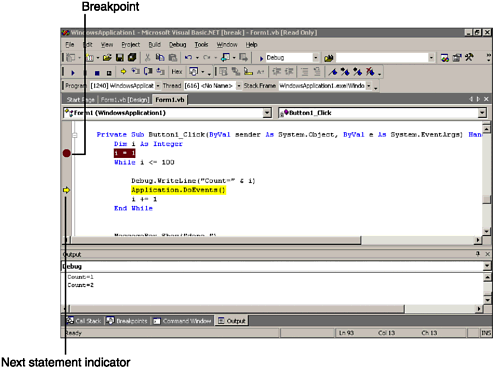
Stopping Program Execution with a Breakpoint An example of a serious bug is accidentally creating an infinite loop. As a test, suppose that you want to use a While loop to print the numbers from 1 to 100 in the Immediate window. Start a new Windows Application project, place a button on the form, and enter the following code in the Click event procedure: Dim i As Integer i=1 While i <= 100 Debug.WriteLine("Count=" & i) Application.DoEvents() Wend Run the program. Before clicking the button, display the Output window (select the View menu, Other Windows, and Output window or press Ctrl+Alt+O). Click the button and you should immediately spot the bug, which causes the same value to be printed over and over again. As a matter of fact, the erroneous While loop will never stop. When you are working in Visual Basic's IDE, you know that you can click the Stop button to end the program, fix the code, and then restart the application. However, to solve a lot of problems, you might want to debug your programs while they are executing. In the case of our sample program, we have created a tight loop, so you may have to right-click on the form in the task bar and choose Close. Go ahead and stop the sample program now. Place the mouse cursor on the line of code at the top of the procedure (i=1) statement and press F9. A red dot should appear in the margin of the code editor, indicating a breakpoint. The next time you run the program, it will stop when it encounters the breakpoint. Run the program again and click the button. Notice that code execution stops (the numbers in the Output window are not printing), but your program is not completely stopped. The forms are still loaded, and the variables still contain their contents. Visual Basic highlights the next statement and places a yellow arrow indicator in the margin of the Code window. This paused state of execution is known as break mode. Breakpoints are lines of code designated to put Visual Basic in break mode before they execute. By using breakpoints, you can run the program normally and then stop execution and begin debugging your code at the desired location. While you are in break mode, you can view or change variable values in the Immediate window. In some cases, you can even modify the code and continue execution. Note You also can enter break mode by using the Break button on Visual Basic's Debug toolbar, or pressing Ctrl+Break.
Tip The easiest way to know whether you are in break mode is to look at Visual Basic's caption, which will have the word [break] in it. You also can look at the buttons on the toolbar, or try to type in the Immediate window.
Note Correcting errors like this one before compiling the program is best. Because users are running outside the Visual Basic IDE, they have no way of pausing or ending an infinite loop other than killing the task from the Windows Task Manager.
In the example, you obviously forgot a statement to increment the counter variable i. Because the value of i never changes, the While condition will never become False. To fix this error, stop the program and modify the code as follows to include the missing line: Dim i As Integer i=1 While i <= 100 Debug.WriteLine("Count=" & i) Application.DoEvents() i = i + 1 Wend Next, press F5 or click the VB Start button after adding the statement. The program should now count up to 100 and then stop. Stepping Through Your Code When you are in mode, you have more options besides restarting execution. You can step through code line by line or skip statements entirely. Visual Basic has three methods of stepping through code, each of which can be performed from the Debug toolbar or a shortcut key: Step Over steps through lines in the current procedure but not through lines in any called procedures (the shortcut key is F10). Step Into steps through lines in the current procedure and into any called procedures (Shortcut key: F11) Step Out runs until the end of the current procedure (the shortcut key is Shift+F11).
Note If your profile is set to "Visual Basic Developer," step shortcut keys will be F8 and Shift+F8. To change your profile settings, choose "My Profile" from the Visual Studio Start Page.
To demonstrate stepping through code, run the sample project again and click the button. Because the breakpoint is still in place, the program should go into break mode. Press F10 several times. Notice that the program executes a line every time you press the function key. It also highlights the next statement in the Code Editor window, as shown in Figure 5.8. Figure 5.8. Breakpoints allow you execute a program up to a certain line; you can then examine a variable's value and continue running to the next breakpoint.  If you want to skip statements or execute them again, you can use the Set Next Statement feature. Simply put the cursor on the statement you want, and then press Ctrl+Shift+F10 or choose Debug, Set Next Statement. You also can drag the arrow in the left margin so that it points to the next statement you want to execute. Try it now: Step through the sample program until the arrow is pointing to the line of code that increments the variable i. Next, drag the arrow back to the previous Debug.WriteLine statement, and step through it again by pressing F10. Notice that you have caused the same value of i to be printed twice. Sending Text to the Output Window We have already demonstrated you can use the Debug.WriteLine statement to send debug text to the Output window. Note In previous versions of Visual Basic, there was no Output window; the Debug.Print statement sent debug information to the Immediate window. This functionality has been replaced by Debug.Write and Debug.WriteLine.
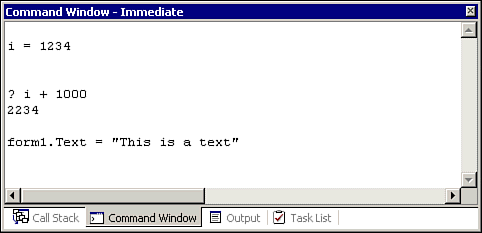
Some other examples of information you might send to the Output window are statements that indicate a section of the program is finished, or how long it took to complete. Working with the Immediate Window The Immediate window provides a way for you to enter code statements while a program is in break mode. To display the window, make sure that the program is in break mode, and press Ctrl+Alt+I or select Immediate window from the Debug Windows menu. Some examples of statements you might enter using the Immediate window are shown in Figure 5.9. Figure 5.9. You can copy and paste statements from the Code window to the Immediate window to execute them manually.  Figure 5.9 demonstrates assigning a variable to a value, printing the variable's value in a mathematical calculation, and setting a form property. Watching Variable Values While you are in break mode, printing out variable values in the Immediate window is common practice. However, Visual Basic includes other special features for keeping track of variables during program execution. One of them is simple; just hover the mouse pointer over the variable name, and the value appears in a ToolTip. The other, more advanced method is to use the Watch window, as shown in Figure 5.10. Figure 5.10. In the Watch window, you can view and change variable values.  To monitor a variable in the Watch window, simply right-click the variable name while in break mode and choose Add Watch from the context menu. Try it now: Start a new Windows Application project. Place a button on the form and enter the following code in the Click event: Private Sub Form_Load() Dim strArray(10) As String Dim i As Integer i = 1234 strArray(0) = "Here is a string" strArray(1) = "Here is another" strArray(2) = "Still another one" End Sub While you are still in Design mode, place a breakpoint on the first assignment statement. Start the program, and click the button. When the breakpoint halts execution, right-click on strArray and choose Add Watch from the Context menu. Note If the Watch window is not visible, press Ctrl+Alt+W or select it from the Windows submenu of the Debug menu.
Note The Watch window supports drag-and-drop. For example, you can highlight a variable in your code with the mouse and drag it to the Watch window to automatically add a new watch.
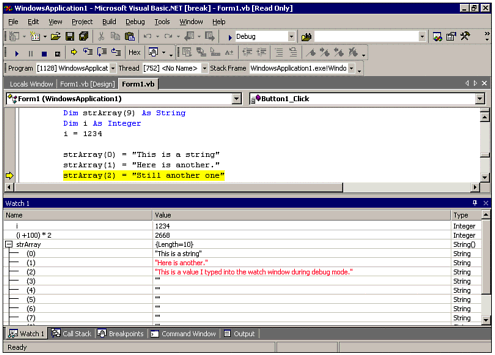
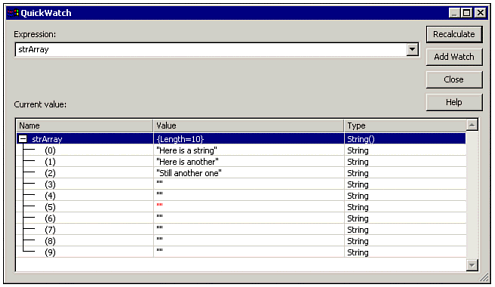
Next, press F10 to step through the lines of code; notice the changes in the Watch window. The values for each element of strArray should be displayed in the window. You can even double-click a variable and enter a new value (which is just like entering an assignment statement in the Immediate window). Also note that variables with multiple dimensions (such as arrays or objects) are displayed in a tree-like hierarchy. This feature can be handy when you are dealing with complex objects such as an ADO recordset. You can also use the Watch window to display simple expressions based on a variable value. The Watch window in Figure 5.10 shows both the value of the variable i as well as the value of i with 100 added, then multiplied by 2. To watch a custom formula, simply click in the Name column of the Watch window and enter the formula. Because the strArray variable is only valid during the button's Click event, if you are debugging another area of the program, the watch entry for strArray will read "Unable to evaluate this expression." If you want to remove an entry from the Watch window, highlight it and press the Delete key. Watches and breakpoints are saved with a Visual Studio solution, so the next time you open it, the watches will return. However, if you just want to temporarily use a Watch window to peek at a variable's contents, you can use the Quickwatch window. To display the Quickwatch window, follow the same steps as you would with the Watch window, but choose "Add Quickwatch." The Quickwatch window is shown in Figure 5.11. Figure 5.11. The Quickwatch window provides the same view of a variable's contents as the Watch window, but cannot be continuously displayed on the screen.  In this section we have described how to manually add a watch. However, Visual Studio .NET also contains several automatic views of the Watch window: Autos Automatically picks variables to watch. Locals Watches local variables only. Me Members of the current object.
All these windows can be displayed from the Windows submenu of the Debug menu. They are in some ways more useful than a manually added watch because they are automatically updated as you enter a different section of code. |