1.7 Prototype System
|
1.7 Prototype System
Recall (from section 1.4) that protein molecules are flexible chains of amino acids. Many sequences will curl up into a compact three-dimensional shape (cf., e.g., White, Handler, and Smith 1968; Stryer 1988). The folded shape is stabilized by electrostatic interactions among its atoms, but possesses at the same time a defined agility that enables it to assume numerous conformational states. Under given physiological conditions, a subset of these states is favored (Frauenfelder, Park, and Young 1988; Freire 1998). A change in physiochemical context can induce a switch to a different favored state. This prevalent protein behavior has two points of significance for novel information processing devices. The first is that proteins have substantial freedom to select the specific stimuli to which they respond and to associate these with a response in an essentially arbitrary way. The intricate conformational dynamics constitutes the second point, because this allows the protein to fuse information in a complex nonlinear fashion that would require large numbers of conventional components to duplicate.
The nonlinear conformational dynamics harbors the computational resource we seek to exploit but at the same time precludes direct engineering of a prototype system. An alternating sequence of exploratory and selective steps can be used instead to sculpt desired functionality. In general, there are three levels open to exploration: the coding of the input signals, the amino acid sequence and operational conditions that control the protein's capacity to fuse input signals, and the choice and interpretation of the output (figure 1.1). The output could, for example, be mediated by fluorescence probes attached to the protein. If the protein is an enzyme, however, its catalytic activity is most often critically dependent on conformational state and therefore provides a sensitive probe for conformation change. Changes in physiochemical context that alter the preferred conformational state of the enzyme will hence modulate the speed of the reaction catalyzed by the enzyme.
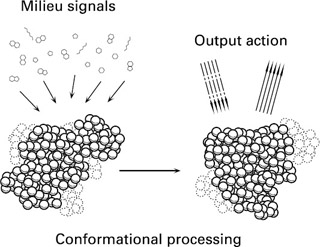
Figure 1.1: Schematic illustration of signal fusion mediated by conformational dynamics.
Enzymes that catalyze reactions involving NAD (nicotinamide adenine dinucleotide) are particularly convenient in this regard, because the oxidized form and the reduced form of NAD have quite different absorbance in the ultraviolet (UV) range. Changes in the concentration of NADH can therefore be observed with little effort by a spectrophotometer.
We used an easy-to-tend enzyme, malate dehydrogenase (MDH), which participates in the citric-acid cycle and is widely available. MDH catalyzes the oxidation of malate to oxalacetate while reducing NAD+ to NADH. For our purposes, we can view MDH as an implementation of a function that takes selected features of its physiochemical milieu as arguments and maps these into absorbance values. Different compositions of the reaction milieu are thereby grouped by MDH into classes of UV absorbance levels (Zauner and Conrad 2000). The aim is to associate input signals with milieu features in a way that results in a useful classification.
The number of potential milieu factors that could conceivably be used to encode input signals is virtually boundless and of course not limited to chemicals of known physiological significance. Only in exceptional cases can mechanistic kinetic models predict the outcome of a specific signal encoding. Furthermore, the cases where mechanistic models apply are likely to be of limited interest from a computational point of view, because the possibility of formulating such models indicates the realm of low-complexity behavior. Instead, empirical models of factor interactions mediated by the protein are employed to discover signal encodings that yield interesting response characteristics.
Sampling the protein's performance under different milieu conditions allows for the construction of a response surface for a small number of the potentially operative factors (Box and Draper 1987; Cornell 1990). Figure 1.2 shows such a response surface for MDH with respect to changes in the MgCl2 and CaCl2 concentration.
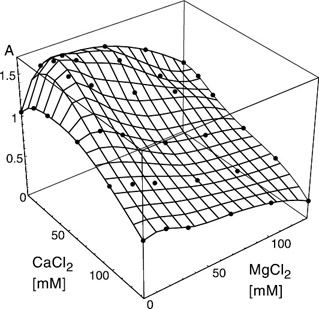
Figure 1.2: Empirical response surface of MDH with respect to CaCl2 and MgCl2. The dots are at concentrations where measurements were made. The surface is obtained by interpolation. (Reprinted with permission from Biotechnol. Prog. 2001, 17, 553–559. 2001 American Chemical Society/AIChE.)
The response surface, once established, can be used to analyze various signal encodings. Different encoding schemes are evaluated according to a performance measure. For pattern classification tasks, the minimum difference in the response to signal patterns that should be grouped into separate classes can serve as the performance measure, to be referred to as signal strength. Only encodings yielding a positive signal strength allow for the implementation of the desired function; in general, an encoding that maximizes signal strength is advantageous.
As a concrete example, consider the exclusive-or (XOR) operation (table 1.2). This can be viewed as a simple arithmetic operation adding two bits without carry. It is also the simplest pattern classification problem that is not linearly separable. For this reason, it is used as a benchmark for learning in natural and artificial systems (Griffith et al. 1968; Minsky and Papert 1969; Ellacott and Bose 1996). The XOR operation groups patterns into one output category when both input signals are the same and into another when the signals are different. The signal strength Δs for the XOR operation can therefore be expressed as
![]()
where the function r denotes the response to the signal pattern (e.g., 00, 01,…, etc.).
| Input 1 | 0 | 1 | 0 | 1 |
| | ||||
| Input 2 | 0 | 0 | 1 | 1 |
| | ||||
| Output | 0 | 1 | 1 | 0 |
| | ||||
With this performance measure, we can ask which signal encoding best adapts the enzymatic system to the desired input-output behavior—here the XOR operation. The empirical response surface shown in figure 1.2 is used as the response function r. The question is how much MgCl2 and CaCl2 should be used for the input signals to maximize the signal strength Δs. Several encoding methods are possible. For example, MgCl2 can be used as the signal carrier on one input line and CaCl2 as carrier for the other input line. The XOR operation, however, is commutative and hence there is no need to encode the signals arriving from different input lines by different carrier substances. It is therefore possible, for example, to encode 1-signals independent of the input line by a mixture of MgCl2 and CaCl2 and 0-signals by a different mixture or the absence of ions. For encodings that use the same carrier substance for both input lines, only signal encodings up to half the concentration range covered by the response surface can be evaluated, because the carrier substances are additive with respect to their contribution to the reaction milieu. Signal strengths for different encoding methods are shown in figure 1.3 as functions of the MgCl2 and CaCl2 concentrations used to represent the signals.
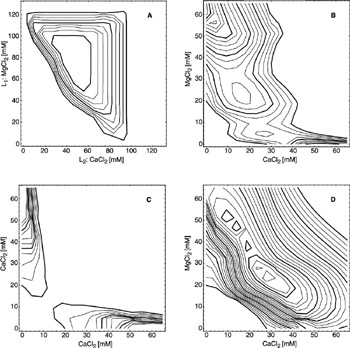
Figure 1.3: Signal strengths for the XOR operation under different signal encoding schemes. The contour lines indicate areas of positive signal strengths, therefore concentrations that make the XOR feasible. Bold contour lines indicate an increase in signal strength of 0.1, the outermost line being 0. (A) Input line 1 releases MgCl2 when a 1-signal arrives on this line. Input line 2 releases CaCl2 under the same condition. When the input is 0 no ions are released. Encoding the input lines by different signal substances makes it possible to utilize the whole concentration range of the response surface. (B) Here both signal lines are encoded the same way, with MgCl2 representing the 1-signal and CaCl2 representing the 0-signal. (C) Input lines 1 and 2 have the same encoding. The 0- and 1-signals are both encoded with CaCl2 concentrations that conse- quently must be different in order to obtain a positive signal strength. The symmetry of the graph reflects the symmetry of the XOR operation with respect to negation of the input signals (cf. table 1.2). (D) In this case the 1-signal is encoded by a mixture of MgCl2 and CaCl2 for both signal lines. The 0-signal is encoded by the absence of these ions. (Reprinted in part with permission from Biotechnol. Prog. 2001, 17, 553–559. 2001 American Chemical Society/AIChE.)
The areas of positive signal strength in figure 1.3 suggest that an enzymatic XOR based on MDH is feasible. To realize such a device, and more generally to explore enzymes as active components for the implementation of pattern classifiers, we constructed the experimental setup shown in figure 1.4. Small piston pumps, each composed of a 3 cm3 syringe and two one-way valves, deliver input signals from reservoirs to a mixing chamber. The two signal solutions, one representing 0-signals and the other 1-signals, contain the same amount of L-malate, a substrate in the reaction catalyzed by MDH. In addition, the solution representing the 1-signal contains MgCl2, while 0-signals are represented by the absence of MgCl2. By injecting a defined amount of MDH/NAD+ solution into the mixing chamber, a reaction is initiated. The reaction progresses while the mixture is pumped to a spectrophotometer and the absorbance of the NADH produced during the transit time is recorded as the output response.
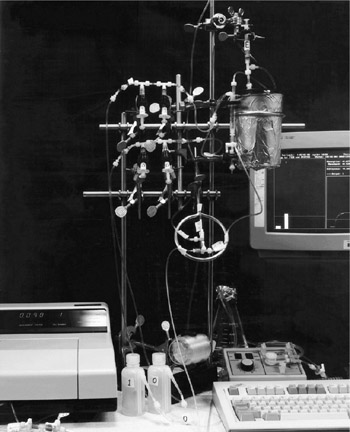
Figure 1.4: Experimental setup for first version of the tabletop XOR module. ( 2001 Zauner.)
Figure 1.5 illustrates the details of an improved version of the prototype in which the spectrophotometer cuvette (Cv) serves as the mixing chamber, thus permitting shorter response times and increased reliability. The injection of the enzyme solution (R1/Sy1) activates microswitches (Ms1, Ms2) that provide a trigger signal for the timing of the measurement used as the output response. A syringe (Sy4) takes up the air displaced when the cuvette (Cv) is filled. Several T-valves (T4–T6), a water reservoir (R4) and a peristaltic pump serve to clear the system between consecutive signal-processing cycles.
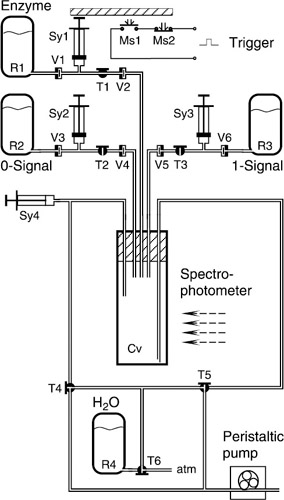
Figure 1.5: Flow diagram for direct injection version of the XOR module. Figure 1.4 shows an earlier version utilizing a mixing chamber separate from the cuvette. (Reprinted with permission from Biotechnol. Prog. 2001, 17, 553–559. 2001 American Chemical Society/AIChE.)
The XOR was also implemented with the improved setup (figure 1.5). The device was required to classify 135 consecutively presented 2-bit input patterns. The response time (i.e., the time period from injecting the enzyme/NAD solution until the output measurement is taken) was set to 10 sec. All 135 input patterns gave rise to response levels that permit correct classification by a single thresholding operation (figure 1.6). The choice of 10 sec is due to the limits of our tabletop instrumentation, not to the underlying process. The prototype demonstrates that enzymes can be used to transform pattern classifications that are not linearly separable into simpler (linearly separable) problems. Of more importance, it points to the feasibility of developing novel computational systems that operate on the basis of high-complexity conformational processors.
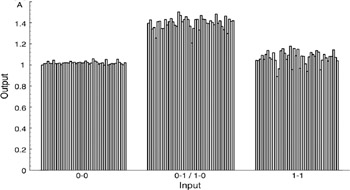
Figure 1.6: Experimental run illustrating repeated operation of the XOR module. The absorbance output separates the 01/10 inputs from the 00 and 11 inputs.
|