7.2 Using metrics
7.2 Using metrics
The following sections describe the different uses we can give to metrics in a project environment.
7.2.1 Controlling and steering projects
In this case, measurements are used to ascertain where the project is in relation to the original plan, and to decide what actions, if any, to take to correct the course or to profit from an unplanned advantageous position.
Controlling and steering is performed by monitoring those project dimensions (i.e., progress, performance, people, product, and customer satisfaction) that the stakeholders regard as critical to the success of the project. Tight project budgets and schedules leave little room for recovery. Once things go awry, it is almost too late to fix them within the original project constraints. Effective and efficient steering requires mechanisms, such as those proposed in Section 7.1.6, that can help identify early signs of trouble before it is too late.
7.2.2 Estimating
A historical database of how much effort and how long it took to perform similar activities in past projects could be of invaluable help in planning new projects. Historical data could be used in the construction of parametric estimation models. These models could be later used to forecast effort and lead time as a function of one or more variables such as size and complexity. Estimation models, however, do not have to be limited to the forecasting of effort and duration; they could be used to estimate the number of errors to be corrected, the weight, the power consumption, or any other technical parameter relevant to the project.
Although the specific steps and the methods used to create parametric estimation models depend on the objectives of the model itself, most are built following a process similar to the one depicted in Figure 7.12.
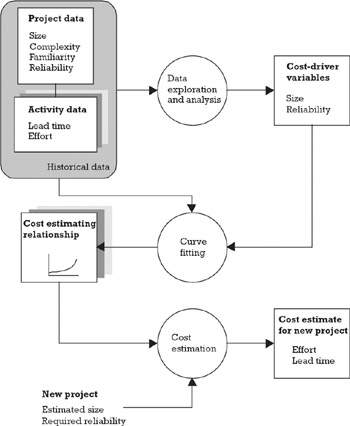
Figure 7.12: Using historical data to build an estimation model.
After the data is collected, some kind of exploratory data analysis is conducted to find the activities' cost drivers; the data is then regressed with respect to these drivers and a set of equations called cost estimation relationships is derived. The equations are later used to estimate new projects.
When collecting data for estimation purposes it is necessary to capture, together with the measurements of the attributes we are interested in, the context information necessary to normalize the data and to relate it to the characteristics of future projects. It is also necessary to time-stamp the data so that it will be possible to discard it when changes in technology or some other fundamental shift in the process makes it obsolete. Another important consideration when using historical data is to monitor the predictions trend to prevent dysfunctional projects from leading the organization productivity downwards, as shown by Figure 7.13.
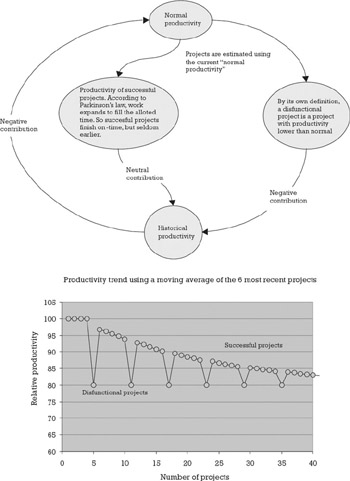
Figure 7.13: Danger of using historical data for estimation purposes. Normal productivity deteriorates over time.
7.2.3 Process improvement
Every process has a bottleneck that its process capability to its present level. The bottleneck could be an activity, a resource, or a policy. Its main characteristic is that any improvements that do not remove the constraints imposed on the process by the bottleneck will not have any effect on the overall R&D chain. Its second characteristic is that bottlenecks are moveable. As soon as the restrictions imposed by the current bottleneck are lifted, something else becomes a bottleneck [5].
Following this line of reasoning, measurement for process improvement should concentrate on two things:
-
Identifying bottlenecks;
-
Conveying an understanding of the forces and structures that shape the process so that it is possible to foresee the consequences to the overall process of removing the constraint.
Most capacity bottlenecks originate in mismatched resources' through-put and in the random variability intrinsic to the nature of development work. Examples of mismatched resources are too many researchers for the testing resources available, which forces researchers to line up for their turn in using the equipment, and too many requests for information for the number of customer support representatives. Examples of variability can be found everywhere. How long does it take to write a project specification?
Based on this, measurements for bottleneck identification should focus on the inter-arrival time between units of work, processing times, and their respective variability. The processing-time information could be derived directly from project data and the inter-arrival data could be extracted from a version control or document management system. When it comes to quality, an approach like orthogonal defect classification (ODC) [6] is required to identify the process constraints. ODC's goal is to provide a multidimensional measurement scale for extracting key information from defects and enable the establishment of cause-effect relationships. Essentially ODC categorizes a defect into classes (see Table 7.1) that collectively point to the part of the process which needs attention, much like characterizing a point in a Cartesian system of orthogonal axes by its (x, y, z) coordinates. The basic ideas of ODC can be extended to other aspects of the process, such as change requests and the tracking of hours spent.
| Time | Status | Impact | Phase | Trigger | Source | |
|---|---|---|---|---|---|---|
| | ||||||
| Definition | Time at which the event occurred | What is being done about it | Where the error would have surfaced during operational use | When the defect was introduced | What made the defect surface | Where the defect was found |
| Use | Measure Inter-arrival distribution and waiting time distribution | Measure queue length and assess project progress | Establish the benefits to be realized by preventing this type of defect | Identify activities that should be improved | Measure activities' effectiveness in finding this type of defect | What are the specific things to which we should be paying closer attention |
| Typical values | Dates at which the defect was reported, assigned, work started, fixed, closed | Reported Assigned | Installation Security | Requirements | Review | Documentation Own product |
Once the process constraints have been identified, we need to give meaning to them; that is, to understand how they relate to other process parameters. One way to do this is to develop influence diagrams like the one used in Chapter 2 to describe the relationships between individual project delays and common management actions. An influence diagram (see Figure 7.14) is a tool for reasoning about systems. Whether a social or a physical system, the diagram shows the relationships between the variables that characterize and influence the system's behavior.
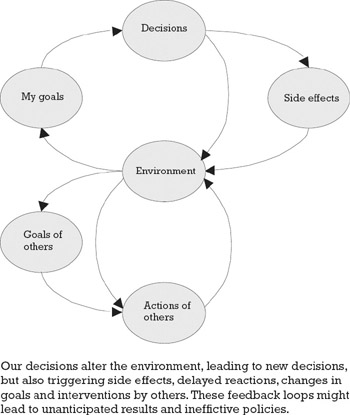
Figure 7.14: Influence diagram showing effect of decisions.
In most systems, complex behavior stems from two simple feedback loops, positive or self-reinforcing loops and negative or self-correcting loops. Positive loops amplify whatever is going on in the system and negative loops oppose or attenuate change (see Figure 7.15). Influence diagrams and their more quantitatively oriented counterparts, system dynamics diagrams, have been used to study project behavior and to recommend actions for at least 20 years. In his influential article, K. Cooper [7], used system dynamics to model the rework cycle in a project and T. Abdel-Hamid [8] (see Figure 7.16) proposed a complete model of the dynamics of a software project.
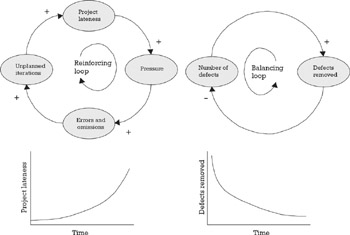
Figure 7.15: Positive and negative feedback loops.
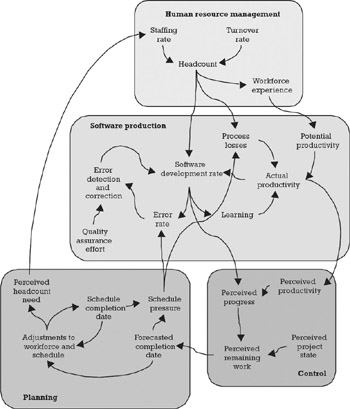
Figure 7.16: Model of software project dynamics showing relationship between different management variables.
EAN: 2147483647
Pages: 81