7.3 Selecting metrics
7.3 Selecting metrics
The purpose of measurement is to help management anticipate potential obstacles to success and, in the event that these potential problems turn into actual problems, to help decide on the best course of action. As the measures of success and the problems that the PO and the individual projects tackle are different, the metrics for the project-based organization must reflect this duality.
While for the individual projects, the objective is to complete their work while meeting cost, schedule, quality, functionality, and technical performance requirements, for the PO the objective is to maximize the benefit for the organization across all the projects and in the long run. To this effect, the PO needs to collect data not only to manage the project portfolio, but for estimation and process improvement purposes, none of which is an immediate concern for the individual projects.
The following sections describe some of the metrics commonly used in the project and the portfolio management environment. The list is necessarily incomplete and the reader is directed to additional resources; excellent material is available in [9] and [10].
7.3.1 Progress metrics
These metrics address the accomplishments of the project toward its final objective in relation to its planned time line.
The assumption behind all the progress metrics is that the future will look more or less like the past. In other words, progress is gradual, and although breakthroughs do occur, if you have not reached what you were set to achieve by a certain time it is unlikely that you will beat all the odds and be able to finish your work in the planned time. Table 7.2 shows some typical metrics for this area.
| Category | Metrics | Description |
|---|---|---|
| | ||
| Work progress | The progress of a specific task could be measured in terms of its main output (i.e., requirements defined, LOC, errors found, pages of documentation written, etc.) | |
| Requirements activity | Number of new requirements specified during the reporting period. | |
| Source code activity | Number of lines of code added, changed, or deleted during the reporting period. | |
| New trouble reports (TRs) | Number of newly written TRs during the reporting period | |
| Closed TRs | Number of TRs solved during the reporting period | |
| Open TRs | Number of unsolved TRs during the reporting period | |
| Technical performance measures | TPM are deliverable specific metrics that track design progress toward meeting customer performance requirements. The technical parameter to be measured depends on the type of deliverable being developed, so here we limit ourselves to cite a few examples. A TPM should be a significant qualifier of the total system, and reflect a characteristic that contributes to system success. Critical technical parameters can be derived from identified risks, system requirements, safety issues, cost/schedule drivers, and mission parameters. | |
| Weight | TPM attribute. Example: an aircraft, where vehicle weight is critical to range and flight economy. | |
| Transactions per second | TPM attribute. Example: an automated reservation system, which should be capable of dealing with thousands of information requests per second. | |
| Mean time between failures (MTBF) | TPM attribute. Example: a telecommunications switch in a telephone network. | |
7.3.2 Performance metrics
These measurements address the amount of resources (i.e., time and money) spent to attain the present level of achievement in relation to the planned expenditures or to target ratios in the organization.
Probably the best-known exponent of this type of measurements is earned value. Table 7.3 shows another common metrics.
| Category | Metric | Description |
|---|---|---|
| | ||
| Earned value | At the most basic level metrics in this category compare the actual cost of the work performed to the budgeted or planned cost of that same work and to the budgeted cost of the work that was scheduled to derive the four measures described below. | |
| Cost variance | Measures the difference (positive or negative) between the actual and the budgeted cost of the work performed. | |
| Schedule variance | Measures the difference (positive or negative) between the budgeted cost of the work performed and the budgeted cost of the work scheduled. | |
| Cost performance index | Is the ratio of the budgeted cost of the work performed to the actual cost of the same work. An index value of 1 indicates that the project spending is proceeding according to the plan. An index below 1 indicates overspending. An index over 1 indicates that work is progressing at a lesser cost than planned. | |
| Schedule performance index | This is the ratio of the budgeted cost of the work performed to the budget cost of the work scheduled. An index value of 1 indicates that the project is progressing according to the plan. An index below 1 indicates delays. An index over 1 indicates that work is progressing at a faster pace than planned. | |
| Productivity | Productivity is the ratio of the amount of product or output of the organization relative to the resources consumed to produce it. There are several options for measuring output. It can be measured in terms of number of products fielded, number of features delivered in the products, or some measure of the size of the products such as lines of code (LOC) or function points (FP). Resources consumed will most likely be represented by effort expended, measured in terms of hours or hours per month. | |
| SLOC-man month | Measures the average amount of software produced, in source lines of code (SLOC), by person by month. Usually is compared to past performance. | |
| Multifactor productivity (data envelopment analysis) | In the case of multifactor productivity, instead of a single input like man-months, the resource consumed is a composite of labor, capital investment, and other resources used in the process. | |
| Ratios | A ratio is simply a number expressed in terms of another, and is used to restate the relative magnitude of the dividend to the divisor using a single number. | |
| Rework ratio | The rework ratio measures the amount of work effort expended to fix defects in relation to the total work. Rework may be expended to fix any product. This measure identifies the quality of the initial project effort, products that need the most rework, and processes that need improvement. | |
| Financial ratios | Ratios such as profit margin and return on investment (ROI) relate the benefits generated by a project to the amounts invested to obtain them. | |
Figure 7.17 shows an analysis of the significance of several cost performance and schedule performance curves. Performance measurements do not tell what is happening with the project, only that things are not going according to plan (whether for good or bad) and should be looked at. Performance measurements are not capable of discriminating between a potential problem originated in the project's execution or a latent one hidden in its plan.
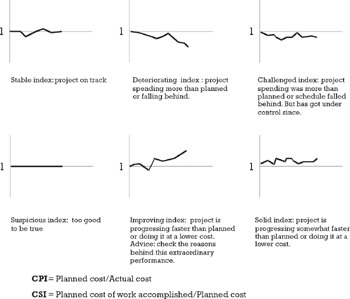
Figure 7.17: Interpreting cost and schedule performance indexes.
7.3.3 People
These measurements relate to the level and adequacy of the staff allocated to the project and to the amount of overtime, direct hours, and employee turnover attributable to a project. See Table 7.4 for some examples of people metrics.
| Category | Metric | Description |
|---|---|---|
| | ||
| Staffing | Measures in this category are used to evaluate the adequacy in terms of number and experience of personnel assigned to a project and the level of stress or morale of the staff. | |
| Staffing variance | Shows the difference between the staff required by the current plan and the allocated head count. | |
| Slack index | This index measures the degree of freedom available for innovation, for knowledge sharing, and for personal and organizational development. Indirectly it measures the margin of maneuver the organization has to respond to a surge in work or an emergency condition. | |
| Overtime index | Overtime is not only expensive, but it is unproductive and harmful if abused. | |
| Voluntary turnover | Each project member who leaves the team causes a productivity drop and schedule disruption. A high turnover rate could be indicative of a morale problem, excessive pressure, etc. | |
While the reasons for tracking the actual staffing levels against the planned ones are obvious, the motivation behind some of the other metrics needs to be analyzed. In Chapter 2 we saw the negative consequences of overtime and fatigue on quality and productivity; furthermore, if key people leave in the middle of the project, or if half the staff is alienated, the damage could be insurmountable for the project and far-reaching for the organization (see Figure 7.18) for an example of staffing charts.
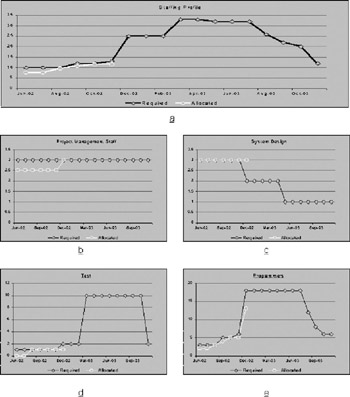
Figure 7.18: Staffing profiles: (a) aggregated across all competence areas; (b–e) for each competence area. This level of detail is necessary because the aggregated curve could mask surplus in one area with shortfalls in another, which are not interchangeable.
Long overtime hours and the lack of any "slack" in the employee work-week are leading indicators of trouble ahead. If a project can only meet its commitment by resorting to continuous overtime and the postponement or abandoning of training and other activities, the sustainability of such a pace shall be brought into question not only from an employee morale point of view but also from a cost perspective.
The employee turnover rate for the project should also be compared with that of the entire organization and other projects for signs of trouble. A project that a large number of people are trying to leave is not a healthy project.
To prevent overreacting to an increase in overtime or employee turnover, it is important to distinguish between random variations in weekly reports and institutional trends. The best way to do this is to use control charts similar to those used in statistical process control (SPC) (see Figure 7.19).
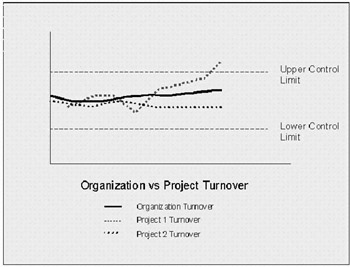
Figure 7.19: Control chart assessing project morale. Project 1 seems to be experiencing a larger-than-expected turnover. This might be indicative of morale problems within the project.
7.3.4 Product
Few things could cause more damage to a project than the lack of stable requirements or changing interfaces. This set of measurements (see Table 7.5) addresses the amount of change or increase in the project's scope of work and technical interfaces.
| Category | Metric | Description |
|---|---|---|
| | ||
| Requirements | Requirements growth | An inordinate number of new requirements might be a sign of an increasing work scope that was never planned for. |
| Requirements churn | A high rate of requirements change can indicate that the customer is not sure of what is wanted, or that the original requirements definition was poor. A high rate often predicts disaster for most projects. | |
| Interfaces | Interfaces churn | An inordinate rate of change of the project interfaces signals an unstable project environment or a very bad design. |
7.3.5 Product quality
Quality in this context refers to the ability of the project deliverable to meet its stated requirements. The reason for taking such a narrow view of quality is that the measurements in this section are used mainly to determine whether or not the project deliverable is ready to be released to the market, transferred to manufacturing, and so on (see Table 7.6). The broader issue of customer satisfaction is addressed in the next section.
| Category | Metric | Description |
|---|---|---|
| | ||
| Functional completeness | The percentage of functional, maybe weighted, requirements implemented versus those defined for the deliverable. | |
| Performance | The percentage of performance, maybe weighted, requirements implemented versus those defined for the deliverable. | |
| Usability | The percentage of usability, maybe weighted, requirements implemented versus those defined for the deliverable. | |
| Reliability | These types of measures are designed to give an indication of the level or continuity of service that could be expected from the delivered product. | |
| Open problems | This measure quantifies the number, status, and priority of the problems reported. The quantity of problems reported is correlated to the amount of rework necessary before the system can be released for full operational use. Arrival rates could be used to determine the worthiness of continuing testing, while closure rates could be used as a predictor of testing completion. | |
| Fault density | Expresses the ratio of the number of problems written against a component relative to its size. It is useful to compare the relative quality of different components. | |
| MTBF | Indicates the amount of time a product can be expected to function without experimenting a failure. | |
| Availability | Indicates the percentage of time that the product is available for use. Is the result of two main parameters: MTBF and mean time to repair (MTTR) | |
7.3.6 Customer satisfaction
Customer satisfaction is defined as how clients perceive and judge the project's attempt to satisfy their needs and fulfill their expectations. Customer satisfaction could be measured directly through questionnaires or indirectly using measurements such as number of items returned and repeated sales. These measures are important to the long-term sustainability of the organization. See Table 7.7.
| Category | Metric | Description |
|---|---|---|
| | ||
| Deliverable | The project's deliverables should be evaluated at least from the following six perspectives. | |
| Functionality | This aspect of customer satisfaction refers to the ability of the product/deliverable to fulfill the customer needs. | |
| Reliability | This refers to the absence or presence of failures that prevent the customer from enjoying the functionality to be provided by the deliverable. | |
| Maintainability | How easy is to fix or upgrade the deliverable? | |
| Performance | How long? How many? How often? At which rate? | |
| Cost | Costs what the customer and the seller agreed it should cost as expressed in a project plan or in updates to it? | |
| Delivery expectations | Is delivered in accordance with schedules agreed to by the customer and the seller in a project plan or in updates to it? | |
| Support | This activity takes place after the output of the project has been delivered, and in consequence, it is not measured within the project itself. | |
EAN: 2147483647
Pages: 81