Section 6.3. Finding Your Trace File(s)
| |
6.3 Finding Your Trace File(s)
Once you have traced a session, your next task is to identify the one or more trace files into which your trace data were written. Each Oracle kernel process creates a single trace file; hence, depending upon an application's architectural configuration, there can be one or more trace files for each traced Oracle session. For example, Oracle Multi-Threaded Server can emit data for a single session into two or more trace files. Your first task will be to identify the directory in which your trace files reside. This step isn't difficult, because there are only two options. The answer is either the setting of the USER_DUMP_DEST Oracle parameter or the BACKGROUND_DUMP_DEST parameter. [2]
[2] I've heard reports of the occasional bug that causes the Oracle kernel to ignore the dump destination parameters and write trace files instead to $ORACLE_HOME/rdbms/log .
Next, you will need to identify the correct file (or files) within that directory. If you were able to tag your trace file name with a unique identifier by setting a session's TRACEFILE_IDENTIFIER attribute, then finding your trace file should be no problem. Simply search the trace file directory for a file name that contains your ID. However, if you were unable to tag your file name ”for example, because you activated tracing for someone else's code from a third-party session ”then your job is a little more difficult.
6.3.1 Trace File Names
One complication is that the various porting groups at Oracle Corporation have chosen different conventions for naming trace files. Table 6-2 illustrates some of the names we've seen in the field. Because there's no cross-platform naming standard, it can seem difficult to write a platform-independent tool that can predict the name of the trace file for a given session. But this isn't too difficult of a problem if your site uses only a few different environments. You simply figure out what pattern the Oracle kernel uses for its trace file names, and then you can predict the file names it will create. For example, on our Linux research server, trace files are named ora_ SPID .trc , where SPID is the value of V$PROCESS.SPID for the session.
Table 6-2. Oracle trace file naming conventions vary by Oracle kernel porting group and by Oracle version
| Oracle trace file name | Oracle version | Operating system |
|---|---|---|
| ora_1107.trc | 8.1.6.0.0 | Linux 2.2.15 |
| ora_31641.trc | 9.0.1.0.0 | Linux 2.4.4 |
| ora_31729.trc | 8.1.5.0.0 | OSF1 V4.0 |
| proa021_ora_9452.trc | 8.0.5.2.1 | SunOS 5.6 |
| cdap_ora_17696.trc | 9.2.0.1.0 | SunOS 5.8 |
| ora_176344_crswp.trc | 8.1.6.3.0 | AIX 3 |
| MERKUR_S7_FG_ORACLE_013.trc | 8.1.7.0.0 | OpenVMS 2-1 |
| ora_3209_orapatch.trc | 8.1.6.3.0 | HP-UX B.11.00 |
| ORA01532.TRC | 8.1.7.0.0 | Windows 2000 V5.0 |
| v920_ora_1072.trc | 9.2.0.1.0 | Windows 2000 V5.1 |
6.3.2 Simple Client-Server Applications
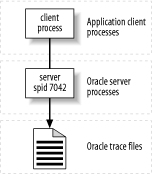
Even in the modern age of complex multi- tier architectures, you probably execute many programs in simple client-server mode, especially batch jobs. Any time you isolate an application component for testing, you're likely to enjoy the same luxury. In such a configuration, any Oracle session creates a single trace file that contains data exactly for that session (Figure 6-1).
Figure 6-1. For simple client-server configurations, there is one server process per session and, therefore, one trace file per session
The absence of a cross-platform trace file naming standard made it difficult for our company to develop a portable software tool to find the right trace file. We considered maintaining a table of file naming patterns (i.e., regular expressions) that we could update as we learned about changes brought on by new ports and new Oracle releases. But we decided that maintaining such a table would be too error-prone . Instead, we landed upon the following algorithm:
-
Given the session ID and serial number for your chosen session (the values of V$SESSION.SID and V$SESSION.SERIAL# ), determine the system process ID (SPID) of your server process. The SPID is the value of V$PROCESS.SPID for your session, which you can find using a join like the one shown in Example 6-3.
-
Identify the directory in which your trace file resides. The directory is the value of USER_DUMP_DEST if V$SESSION.TYPE=' USER '; it is BACKGROUND_DUMP_DEST if V$SESSION.TYPE='BACKGROUND '.
-
List the contents of that directory, ordered by descending file modification time (for example, using ls -lt in Unix). Note that a file modification time (or mtime ) typically has resolution of one second. Hence, if two or more trace files are created in the same second, then it is impossible for you to know which one is newer by comparing their mtimes .
-
For each file in that list whose mtime is more recent than the time at which your data collection began (it is possible to be more precise than this, but comparing the mtime to the data collection begin time is a more conservative approach):
-
Seek to the final preamble in the file. This is especially important on Microsoft Windows platforms, where the Oracle kernel tends to reuse trace file names frequently, and where the kernel appends to existing trace data. (Therefore, it is possible to have two or more preambles in a single trace file.)
-
Search the preamble for the line containing the string "pid" (on Unix variants and OpenVMS) or "thread id" (on Windows). The preamble consists of all the lines up to the line that begins with the string " *** ".
-
If the number following "pid" or "thread id" matches the SPID for your chosen session, then you have found your file, and you may stop searching.
If you exhaust the list of files without finding a matching system process ID, then stop searching; the file or files you are looking for do not exist.
-
I have written portable Perl code that implements approximately these steps as a part of project Sparky , which you can read about at http://www.hotsos.com.
This method of peeking at file content may strike you as inelegant, especially if your shop uses only one or two operating systems. However, the algorithm has the advantage of reliability across platforms and across Oracle software upgrades. The algorithm scales well with respect to the number of trace files in the directory. It scales less well if the trace files being peeked at are very large and contain several preambles.
6.3.3 Oracle Parallel Execution
Using Oracle's Parallel Execution (PX) capabilities causes an Oracle kernel process to fork two or more child processes (called PX slaves ) to fulfill the responsibilities of parallel reading and parallel sorting. PX slave processes inherit the tracing attributes of their query coordinator . Consequently, activating extended SQL trace for a session that uses PX features will generate several relevant trace files. The remaining task is to identify and analyze all of the relevant trace files. This task is usually simple enough to do by assessing the modification times of the most recently generated trace files. For queries using parallel degree p , the number n of relevant trace files will be in the range 1  n
n  2 p + 1 per enlisted instance.
6.3.4 Oracle Multi-Threaded Server
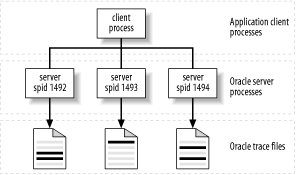
Using Oracle's Multi-Threaded Server (MTS) capability makes finding your trace data a little more complicated. MTS allows switched connections, which creates a one-to-many relationship between an Oracle session and the Oracle kernel processes that service database calls made by the session (Figure 6-2). Thus, the trace output from a single session can be scattered throughout two or more trace files. The Oracle kernel does provide complete session identification and timestamp data each time a session migrates to a new server process (and hence a new trace file). It is straightforward to create the logical equivalent of a single trace file for a given session. The modifications to the method for finding trace files detailed previously are:
-
Depending upon your version of Oracle, your shared server trace files may reside in BACKGROUND_DUMP_DEST (my staff and I have seen this behavior on some release 7 and 8 platforms), or they may be in USER_DUMP_DEST (we've seen this behavior on release 9).
-
Instead of quitting when you find one trace file with the correct session identification information within it, you must continue searching all the trace files with qualifying modification times.
-
Once you've identified all the files that contain relevant trace data, you must discard the irrelevant data from sessions other than the one in which you're interested, and then you have to merge the resulting data. First, discard segments of trace data that correspond to sessions other than the specified session. You can determine easily which sections you want to keep by observing the session ID lines that begin with *** . Finally, merge the remaining segments of trace data into ascending time order. This is also an easy step because the *** lines contain times as well. The result is a "virtual" trace file containing only the session information that you require. You can perform this step by hand with a multi-window text editor, or you can purchase a tool that can do it for you. We have created such a tool at www.hotsos.com, which we sell as a commercial product.
Figure 6-2. Oracle Multi-Threaded Server uses a one-to-many relationship between client and server processes; hence, MTS can stream data about a session into more than one trace file
6.3.5 Connection-Pooling Applications
As I described earlier, connection pooling is a valuable technique designed to reduce the number of database connect and disconnect calls. Connection-pooling applications are only as easy to diagnose as their design permits . If an application is instrumented in such a manner that the database calls executed on behalf of a user action can be identified, then your data collection job will be easy. Unfortunately, many connection-pooling applications are not instrumented in this way. I believe that the release of Oracle release 10 will facilitate the creation of such instrumentation over the next several years .
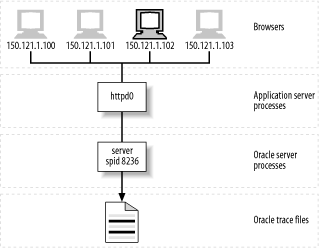
The performance diagnostic problem of connection pooling occurs when the application server conceals the identity of the end user from the database. Because several users share a single session, it is impossible to determine from the trace file alone which user has motivated a given line of trace data (Figure 6-3).
|
If your application lacks instrumentation to facilitate tracing of an individual user's SQL, you are not alone. There are of course other ways you can make progress. Consider the following scenario: a user named Nancy at IP address 150.121.1.102 has reported a performance problem with the connection-pooling order entry application shown in Figure 6-3. The application does not facilitate the identification of Nancy's extended SQL trace data.
Figure 6-3. A connection-pooling architecture. Unless the middle tier records a mapping of end user identity to database call, there will be no way to determine which user motivated which lines of trace data
One simple strategy is to force all users other than Nancy to cease their use of the system temporarily. Then activate extended SQL tracing for Nancy's service and allow Nancy to execute her slow business function. When the function has completed, deactivate tracing and allow all the other users back onto the system. This strategy has proven effective in some limited cases, but in addition to the obvious business disruption, it has a profound diagnostic disadvantage . If Nancy's performance problem is the result of competition with other sessions, then the data collected with this method will be devoid of evidence of the problem's root cause.
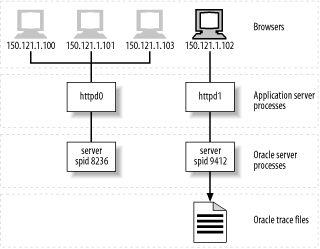
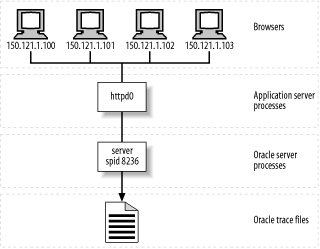
A more powerful workaround is possible if you can alter the architecture temporarily to isolate Nancy's session. Figure 6-4 shows one way in which you might accomplish this modification. In this figure, I show the isolation of Nancy's session by supplying her with her own application server process and single dedicated Oracle server process. One way to accomplish this switch-over is to provide Nancy with a special "service identifier" (the application service layer analog of a special TNS alias) that provides connection to the special diagnostic application server process.
A commonly stated objection to this method is that the architecture change might itself influence the performance behavior of Nancy's session while it is being diagnosed. However, the change is more localized in this case than in the first workaround I described, because you haven't changed the workload that competes with Nancy. Certainly, you will need to investigate the changes you have made, especially if you notice that an architecture change does beget a performance change. For example, if the modified architecture shown in Figure 6-4 produces consistently faster performance than the one shown in Figure 6-3, then you might investigate whether the httpd0 application server process might be a significant participant in the problem.
Figure 6-4. If you can isolate the user's workload so that no other user action's database call lines appear in its Oracle trace file, then the diagnostic data collection is no more difficult than in the simple client-server case
A final strategy that I'll describe here is possible only if all the users who share one or more Oracle server processes with Nancy are doing approximately the same type of work as Nancy is doing. If all the connections that use the server processes are submitting the same kinds of workload, then each of the lines in the resulting trace file will be approximately representative of Nancy's workload, as illustrated in Figure 6-5.
Figure 6-5. If all the users who use the Oracle server processes shown here are doing approximately the same type of work, then any of the workload depicted in the trace file is an approximate representation of any individual user action's workload
Of course, it is true that you "cannot extrapolate detail from an average" and therefore, considering a single trace file as representative of Nancy's work bears a risk (see Chapter 3). However, in this case, our knowledge of session homogeneity is vital additional information. It's as if I had told you that the mean of a list of numbers is eleven and that the numbers are all approximately the same . That extra bit of information ”that the numbers are all approximately the same ”enables you to extrapolate legitimate conclusions about the data behind the mean. If all the users who share an Oracle server process are doing approximately the same type of work, then you can consider any line of trace data in the resulting trace file as an approximate representation of any user's workload.
6.3.6 Some Good News
Data collection is more complicated for application configurations that allow a single application user action to distribute its database calls across two or more distinct Oracle kernel processes. Of course, this is the strategy employed by virtually all applications being built today. I hope that the problem of trace data identification is one motivation behind Oracle Corporation's significant investment into diagnostic changes scheduled for Oracle release 10. I do believe that the problem shall become easier to manage in the future. There are two pieces of good news for today, however:
-
Collecting extended SQL trace statistics for many batch jobs is easy, and it should continue to be so, even in the increasingly n -tier world, because the best configuration for many batch jobs is to run with a dedicated Oracle server process.
-
Every data collection problem that my colleagues have encountered so far has a practical solution. I hope the www.hotsos.com web site is one of the first places you'll check for new developments as they occur.
| |
| Top |
EAN: 2147483647
Pages: 102
