Formatting Charts
|
| < Day Day Up > |
|
Graph gives you the ability to format all the different elements your chart includes. You might want to change the font of a title, resize the labels, change the background color, change the line thickness, apply a pattern, or do any number of other things.
To choose the chart object you want to work with, double-click the chart, and then click the Chart Objects arrow on the Standard toolbar. A list of possible objects appears, as shown in Figure 14-11. Click your choice, and then Graph selects that item in the chart. You can then right-click the item to display a format choice-for example, right-clicking a legend displays a shortcut menu with Format Legend. When you select that command, a formatting dialog box appears in which you can select the Patterns, Font, and Placement for the legend.
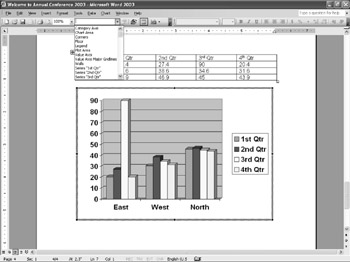
Figure 14-11: Use the Chart Objects list to select the chart element you want to work with.
| Note | The formatting commands available-and the tabs in the different Formatting dialog boxes-vary widely depending on the type of chart you're creating and the chart element you've selected. Right-clicking a chart axis, for example, displays a very different set of choices than right-clicking the legend does. |
Working with Patterns
You work with patterns in Graph to format a number of different items:
-
Do you want a border around your chart? If so, what kind? You make those choices in the Patterns tab in the Format dialog box.
-
Do you want to choose a different color for the lines in your chart?
-
Would you like to add a drop shadow to the chart?
-
Do you plan to recolor any or all of the data series lines or bars in your chart?
You can change each of these items by displaying the Format dialog box and clicking the Patterns tab, as shown in Figure 14-12. By default, Graph includes a single-line border, but you can customize and modify the lines used to enclose your chart. Additionally, you can experiment with fill colors for the chart area. The Sample preview box in the lower-left corner shows you the effect of your changes.
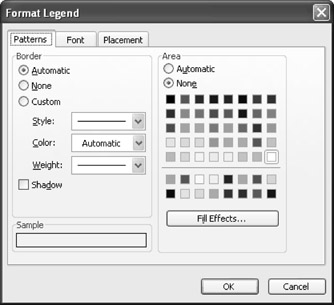
Figure 14-12: You can modify settings in the Patterns tab in the Format Legend dialog box to change the chart's border and color scheme.
Changing Fonts
There's no big secret about changing fonts in a chart-simply select the text you want to change and change it as you would text in your document. You can use the buttons on the Formatting toolbar (which is available even when Graph is active), or you can choose Format, Font. The Format dialog box appears with the Font tab selected, as shown in Figure 14-13, and you can modify the font, style, size, underline, color, background, and effects.
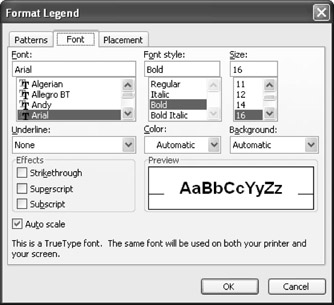
Figure 14-13: You can easily change the fonts used for titles and labels in your chart by using the Font tab in the Format Legend dialog box.
| Tip | Control the size of titles and labels The Auto Scale check box in the Font tab in the Format dialog box is selected by default-this means that Graph will resize your titles and labels to fit the chart if you resize it. If you want the titles and labels to stay the same size no matter how much the chart is enlarged or reduced, clear the Auto Scale check box. |
You might notice that your 3-D chart angles to the left by default. You might find, however, that the other design elements on your page have a different orientation. In this case, you need to be able to change the chart layout. Graph provides the following elevation and rotation options for 3D charts, which enable you to do just that:
-
Elevation The vertical distance from which the reader's perspective of the chart is measured. For example, with an elevation of 30, the elevation is twice as "high" as the same chart viewed with an elevation of 15.
-
Rotation The degree to which the chart is rotated away from the head-on view. Raising Microsoft's default value of 20 to 40 turns the chart further to the left.
-
Perspective Another option available for some charts. This option enables you to change the depth of the chart by increasing or decreasing the value.
To change the elevation, rotation, and perspective for your 3D chart, double-click the chart, and then choose Chart, 3-D View. Experiment with the Elevation and Rotation until you get the effect you want. Click Apply and then OK to return to your document.
|
| < Day Day Up > |
|
EAN: 2147483647
Pages: 373