Section 3.12. Managing Complex Activity Diagrams
3.12. Managing Complex Activity DiagramsActivity diagrams have many additional symbols to model a wide range of processes. The following sections feature some convenient shortcuts for simplifying your activity diagrams. See UML 2.0 in a Nutshell (O'Reilly) for a more complete list. 3.12.1. ConnectorsIf your activity diagram has a lot of actions, you can end up with long, crossing lines, which make the diagram hard to read. This is where connectors can help you out. Connectors help untangle your diagrams, connecting edges with symbols instead of explicit lines. A connector is drawn as a circle with its name written inside. Connectors are typically given single character names. In Figure 3-26, the connector name is n. Connectors come in pairs: one has an incoming edge and the other has an outgoing edge. The second connector picks up where the first connector left off. So the flow in Figure 3-26 is the same as if Step 3 had an edge leading directly into Step 4. Figure 3-26. Connectors can improve the readability of a large activity diagram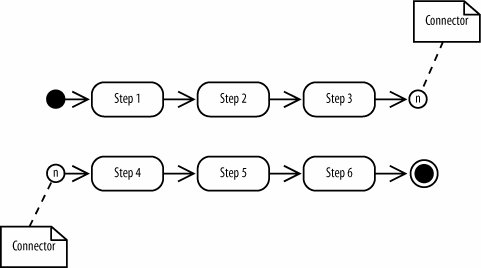
3.12.2. Expansion RegionsExpansion regions show that actions in a region are performed for each item in an input collection. For example, an expansion region could be used to model a software function that takes a list of files as input and searches each file for a search term. Draw an expansion region as a large rounded rectangle with dashed lines and four aligned boxes on either side. The four boxes represent input and output collections (but they don't imply that the collection size is four). Figure 3-27 shows that the bug report is discussed for each bug report in an input collection. If it's a real bug, then the activity proceeds; otherwise the bug is discarded and the flow for that input ends. Figure 3-27. The actions in an expansion region are performed for each item in a collection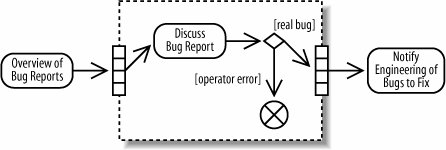 |
EAN: 2147483647
Pages: 175