Performance Monitoring Samples
This collection of samples is provided to illustrate how, with a minimal collection of performance counters, you can monitor a cluster and its members. It also demonstrates how you can test a cluster and its applications by applying a load to the cluster with the WAS tool.
Before proceeding further with our monitoring examples, there are two items that need to be highlighted: the test configuration we're using for our examples and the counter graphs.
Cluster Test Configuration
It's important to note that the test server configurations we used for working with cluster scenarios in this book are not representative of typical production servers. You should not infer any performance expectations from these tests.
If you examine the configuration summary provided in Table 10.11, you'll see that our test servers are by no means capable of delivering the same levels of performance as the servers that most of you use in a production environment. Keep this in mind when looking at the performance results provided later in this chapter. View these results as conceptual illustrations in the context of our test computers; don't use the results as performance metrics for your own equipment.
Table 10.11 Computer Configurations Used in Test Clusters
| Server name | Cluster type and role | CPU | Memory | Bus Speed |
|---|---|---|---|---|
| ACDW516AS | Web, controller | 1xP6-550 | 256 MB | 66 MHz |
| ACDW802AS | Web, member | 1xP6-366 | 256 MB | 66 MHz |
| ACDW518AS | Web, member | 1xP6-550 | 256 MB | 66 MHz |
| ACDW522AS | COM+, controller | 1xP6-366 | 256 MB | 66 MHz |
| ACDW811AS | COM+, member | 1xP6-233 | 256 MB | 66 MHz |
| ACDW822AS | Web, stager | 1xP6-266 | 128 MB | 66 MHz |
Counter Graphs
When you're graphing different counters, you should be aware of how the individual counter values are rolled up at the server and cluster level. Table 10.12 lists the default counters and the aggregation method that is used at the server and cluster levels. Figure 10.6 illustrates how three counters (Processor Utilization, Web Service GET Requests per second, and ASP Requests per second) are rolled up to the cluster level.
Table 10.12 Counter Aggregation at the Server and Cluster Levels
| Counter name | Server aggregation | Cluster aggregation |
|---|---|---|
| ASP Errors per second | Average | Sum |
| ASP Requests Queued | Average | Sum |
| ASP Requests Queued | Max value | Max value |
| ASP Requests per second | Average | Sum |
| ASP Request Execution Time | Average | Average |
| ASP Request Wait Time | Average | Average |
| Memory Available Bytes | Average | Average |
| Memory Page Faults per second | Average | Average |
| Physical Disk Queue Length | Average | Sum |
| Inetinfo Private Bytes | Average | Average |
| Processor Utilization | Average | Average |
| Processor User Time | Average | Average |
| Processor Privileged Time | Average | Average |
| Log Database Total Memory | Average | Average |
| Context Switches per second | Average | Average |
| TCP Connections Established | Average | Sum |
| Web Service Current Connections | Average | Sum |
| Web Service GET Requests per second | Average | Sum |
| Web Service Bytes Total per second | Average | Sum |
| Web Service ISAPI Requests per second | Average | Sum |
In Figure 10.6, the graph plots are denoted as follows:
- A: Processor Utilization
- B: Web Service GET Requests per second
- C: ASP Requests per second
NOTE
This labeling convention is used for all the sample performance graphs in the balance of this chapter.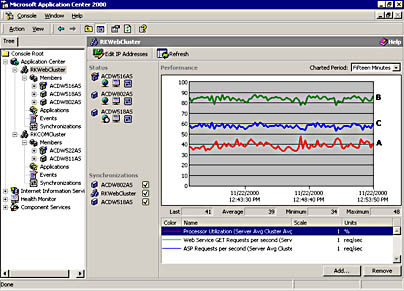
Figure 10.6 Performance graph for a Web cluster with two load-balanced nodes
Referring to Figure 10.6, note that the Processor Utilization is averaged, whereas Web Service GET Requests and ASP Requests are summed.
NOTE
Application Center performance charts exhibit the same behavior as the Windows 2000 Performance Monitor. The values used for the counter graph appear out of synchronization with the numeric values (for example, Min, Max, and Average) that appear below the graph. This is because the graph uses the values for the specified period (for example, 15 minutes), but the numeric display uses all of the values that are accumulated during the session—the session context is defined by when the Application Center snap-in is first activated.
Let's move on and work with some performance monitoring examples that employ the servers and applications that we described in Chapter 8, "Creating Clusters and Deploying Applications."
The Base Environment
Our test environment uses the same application, clusters, and members that we described in Chapter 8, "Creating Clusters and Deploying Applications." We started testing by using the following configuration, and as we tested, we changed this topology by scaling out the front-end and back-end clusters. Only a few of the performance graphs produced by our testing are shown in this section. However, the entire collection of performance graphs for the various cluster topologies is included in Appendix E, "Sample Performance Charts."
Initial Topology and Cluster Configuration
The following cluster topology was used for performance testing:
- A front-end Web cluster (RKWebCluster) that consists of a single member, the cluster controller, ACDW516AS
- A back-end COM+ application cluster (RKCOMCluster) that also consists of one member, ACDW522AS, the cluster controller
The Web cluster was configured as follows:
- Web request forwarding disabled
- NLB client affinity set to custom (none)
- HTTP keep-alives disabled
- Load balancing weight equal for all members
Application
We used the Pre-Flight Check application for testing and distributed it across two tiers, as described in Chapter 8, "Creating Clusters and Deploying Applications." The HTML and ASP pages are hosted on the Web tier, and the COM+ applications, AC_PF_VB and AC_PF_VC, are hosted on the COM+ application tier. Component Load Balancing (CLB) was enabled by configuring the AC_PF_VB and AC_PF_VC components to support dynamic load balancing, and ACDW522AS was identified as the member for handling component requests.
Performance Counters
Before applying a test load to the controller, we added three counters to the performance graph for the controller: Processor Utilization, Web Service GET Requests/second, and ASP Requests/second. We also added the Processor Utilization counter to the performance chart for the COM+ server. Because we're not doing any in-depth performance tuning or capacity planning, these counters are sufficient to give us a good indication of cluster performance under load and illustrate the effect of scaling out a cluster and adjusting server load balancing weights.
WAS Configuration
We used the ACPreflight script, which is included on the Resource Kit CD, for our tests and retained the script's default settings for HTTP verbs, page groups, users, and cookies.
Four WAS clients were used for testing, and the following settings were changed from their default configurations:
- Stress level (threads)—88
- Use random delay—0 to 1500 milliseconds
- Suspend and Warmup—5 minutes
Scenario: Single-Node Web Cluster and Single-Node COM+ Application Cluster
In this first scenario, we wanted to push processor utilization up fairly high, which is why we reduced the amount of random delay that is used for TCP connections. Figure 10.7 shows the results we achieved.
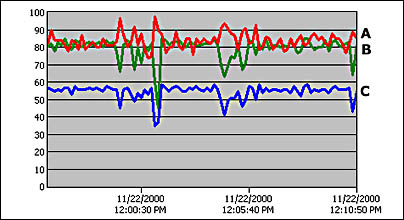
Figure 10.7 Performance results on a single node Web cluster
The next scenario illustrates the affect that adding an additional server has on the performance indicators shown in Figure 10.7.
Scenario: Two-Node Web Cluster and Single-Node COM+ Application Cluster
For this scenario, we added the server ACDW802AS, which, as you may recall from Table 10.11, is a less robust computer than the cluster controller. However, even this server had a significant impact on the controller's performance. Figure 10.8 shows the affect that this server had on the controller's processor utilization.
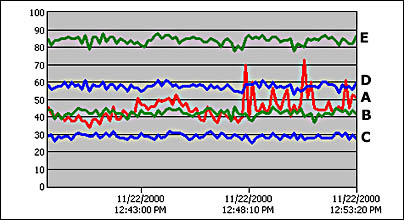
Figure 10.8 Cluster controller (ACDW516AS) performance after creating a two-node cluster
If you compare the new Processor Utilization (A), Web GET Requests (B), and ASP Requests (C) indicators with those for the same server in Figure 10.7, you can see a noticeable difference in resource usage after adding another cluster member. Throughput decreases as well, but only on the cluster controller. The graph lines labeled D and E show the cluster total throughput for HTML and ASP pages. As you can see, total throughput is higher than on a one-node cluster.
Scenario: Three-Node Web Cluster and Single-Node COM+ Application Cluster
For this scenario, we added a third member, ACDW518AS, to the Web cluster. As expected, resource utilization decreased on the two original cluster members, but as you will note in Figure 10.9, the new member is underutilized in comparison to the other members.
The graph labeled ACDW802AS in Figure 10.9 includes Processor Utilization (A1) for the cluster controller as well as the member. For clarity, the controller's Web GETs and ASP requests aren't displayed, but their performance is at the same level as the member. If you look at the performance graph (ACDW518AS in Figure 10.9) for the new member, you'll see that although ACDW518AS has the same level of throughput as the other members—indicating that the load is well-distributed on our test cluster—Processor Utilization is significantly lower on this member.
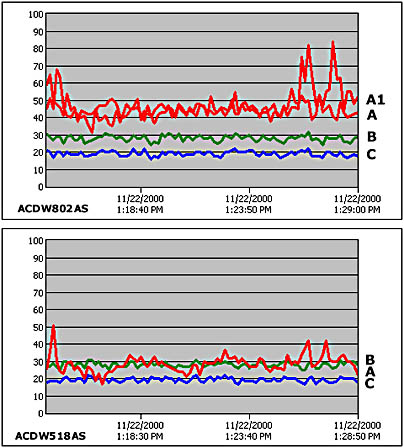
Figure 10.9 Resource utilization and throughput on ACDW518AS
In the next scenario, we'll adjust the load balancing weight to reduce resource usage on the controller (ACDW516AS) and ACDW802AS.
Adjusted Load Balancing Weight
In order to take advantage of the lower processor utilization on ACDW518AS, we decided to increase the load balancing weight on this member. In the membername Properties dialog box, we set the server weight at the midway mark between the Average load and More load indicators.
NOTE
The impact of the amount of load added to a single member is more pronounced as the number of clients increases. Nonetheless, the graphs in Figure 10.10 serve to illustrate how a load balancing weight adjustment affects server performance.
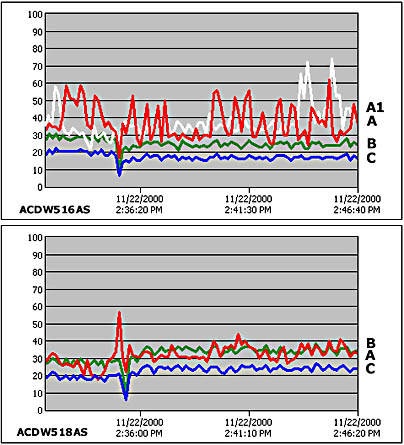
Figure 10.10 Resource utilization on ACDW518AS after adjusting the load-balancing weight
Referring to Figure 10.10, the graph labeled ACDW516AS shows our base performance metrics for Processor Utilization (A), Web GET Requests (B), and ASP Requests (C) after load balancing was adjusted. Note the following:
- Both graphs show a spike. Note that the throughput is dropping and processor utilization is increasing, just before the first date/time indicator on the chart. This is the point where the weight was adjusted on ACDW518AS and the convergence took place.
- In the ACDW518AS graph, you can see where throughput and processor utilization increased after convergence.
- The white plot line (A1) in the ACDW516AS graph shows processor utilization for the cluster controller, taken from a previous test that was run before the load balancing adjustment. As you can see, processor utilization did decrease on the controller, as did throughput. Similar performance results were experienced on the ACDW802AS cluster member.
NOTE
Even though the controller is the same class of server as ACDW518AS, higher processor utilization on the controller was expected. There are two reasons for this. First, there is a performance cost associated with the controller role; and second, there is the monitoring cost. For our tests, we used the cluster controller for all the performance monitoring displays that were generated.
Our final scenario demonstrates the effect of scaling out the COM+ application cluster.
Scenario: Three-Node Web Cluster and Two-Node COM+ Application Cluster
Up to this point, we've been using a single server on the back-end component server tier to handle all the COM+ requests coming from the Web cluster. Processor utilization on this server typically ranged from 50 percent to 65 percent during our tests. Figure 10.11 provides two graphs. The first, labeled ACDW522AS/ACDW811AS, shows the processor utilization for the component servers in RKCOMCluster, the COM+ application cluster. The second graph, labeled RKWebCluster, provides a cluster-wide performance view.
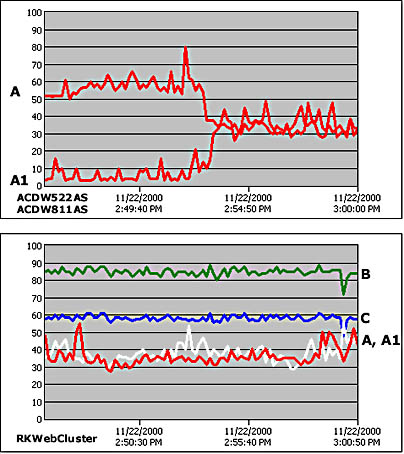
Figure 10.11 Resource utilization after scaling out the COM+ application cluster
Let's examine the graphs shown in Figure 10.11 in more detail, starting with the component servers. The cluster controller's processor utilization graph is labeled A; the new member's graph is A1. As you can see, the point where the new member is brought online is noticeable (approximate time 2:53 P.M.) and the reduction in the controller's processor load is significant. After the cluster is scaled out, processor utilization for both servers is evenly matched, which indicates that component requests are being well distributed between the two servers.
The RKWebCluster graph provides a cluster-wide performance view, with Web GET Requests and ASP Requests aggregated as totals for all the members.
NOTE
The throughput levels indicated in the RKWebCluster graph remained consistent in all of our test scenarios. There were, of course, occasional drops when members were added, load-balancing weights adjusted, or cluster synchronization took place.
Two processor utilization graphs (A and A1) are shown. The dark line is the graph for processor utilization after the COM+ application cluster is scaled out; the while line shows processor utilization when there was only one COM+ application server in RKCOMCluster. As these graphs indicate, scaling out the COM+ application cluster resulted in reduced processor utilization across the Web tier.
The testing we did for this chapter is by no means exhaustive, but it gives you an idea of the performance monitoring capability that is at your disposal. To summarize, the Application Center performance monitoring interface:
- Provides a commonly used collection of pre-installed performance counters
- Supports the creation of additional counters on a per-member or cluster-wide basis
- Supports a single console view for monitoring an individual member, an entire cluster, and multiple clusters
EAN: N/A
Pages: 183