The Sample Monitors
A collection of sample monitors is also provided that you can use as is or tailor to meet your monitoring needs. These monitors can be installed by using the Custom Setup option, either during the initial product installation or after you've installed Application Center. The MOF file that's used to define and create these monitors is named Samples.mof (located in Program Files\Microsoft Application Center\Samples). The next collection of figures (Figure 9.9 through 9.16) describes the hierarchy for the sample monitors.
Note that this collection of monitors includes data groups and data collectors for products other than Application Center, such as Microsoft BizTalk Server 2000, Microsoft Commerce Server 2000, and Microsoft SQL Server 2000.
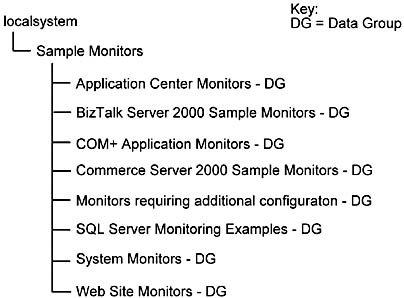
Figure 9.9 The top level of the Sample Monitors hierarchy
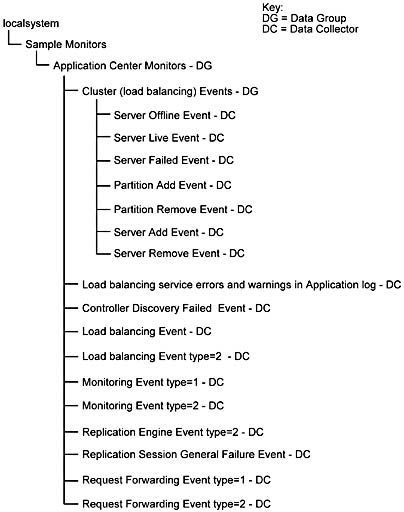
Figure 9.10 The Application Center Monitors hierarchy under Sample Monitors
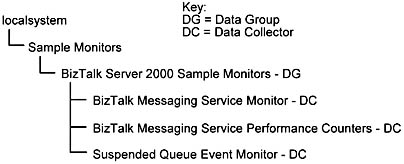
Figure 9.11 The BizTalk Server 2000 Sample Monitors hierarchy
The BizTalk Server monitors collection allows you to monitor BizTalk servers on your cluster. The monitors include the following data collectors:
- BizTalk Messaging Service Monitor—checks the status of the BizTalk Messaging Service. This data collector monitors the Display Name, Started, State, and Status properties of the BTSSvc Service.
- BizTalk Messaging Service Performance Counters—monitors performance counters that are enabled for the BizTalkServer object.
- Suspended Queue Event Monitor—checks for documents in the suspended queue by querying the DocSuspendedEvent class in the root\MicrosoftBizTalkServer namespace.
Some of these monitors do not have thresholds; you will have to create the required thresholds according to the specific needs of your environment.
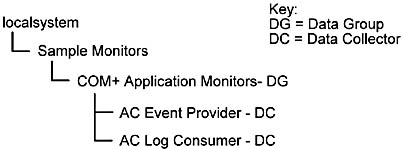
Figure 9.12 The COM+ Application Monitors hierarchy
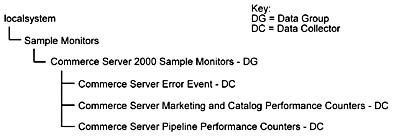
Figure 9.13 The Commerce Server 2000 Sample Monitors hierarchy
The Commerce Server monitors collection allows you to monitor Commerce Server installations on your cluster. The monitors include the following data collectors:
- Commerce Server Error Event—checks for Commerce Server error events in the Application event log.
- Commerce Server Marketing and Catalog Performance Counters—monitors the following counters for a Retail and Supplier instance of the CS2000MarketingAndCatalog object: LRUCache: Cache size, LRUCache: Flushes/sec, LRUCache: Hits/sec, and LRUCache: Misses/sec.
NOTE
By default, all sites are monitored. This data collector can be limited to a single site instance.
- Commerce Server Pipeline Performance Counters—checks the Executions Total and Errors Total counters for the CS2000Pipelines object.
NOTE
By default, all pipelines are monitored. However, there may be more than one pipeline that is getting monitored, which results in an error returned by the data collector. You should create multiple copies of this monitor, one for each pipeline instance.
Some of these monitors do not have thresholds; you will have to create the required thresholds according to the specific needs of your environment.
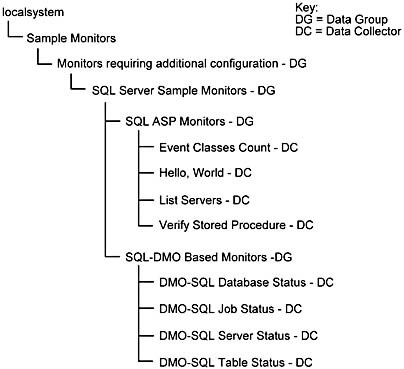
Figure 9.14 The Monitors requiring additional configuration hierarchy
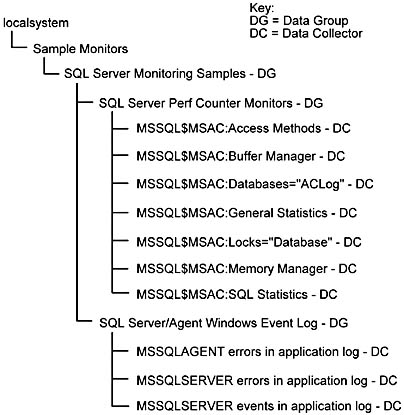
Figure 9.15 The SQL Server Monitoring Samples hierarchy
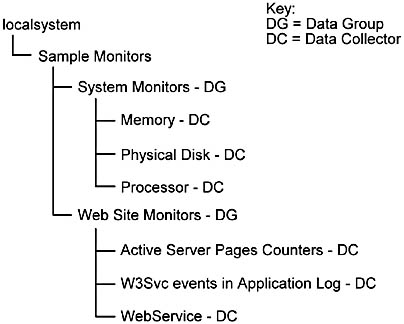
Figure 9.16 The System and Web Site Monitors hierarchy
EAN: N/A
Pages: 183
- The Four Keys to Lean Six Sigma
- Key #1: Delight Your Customers with Speed and Quality
- Making Improvements That Last: An Illustrated Guide to DMAIC and the Lean Six Sigma Toolkit
- The Experience of Making Improvements: What Its Like to Work on Lean Six Sigma Projects
- Six Things Managers Must Do: How to Support Lean Six Sigma