Network Load Balancing Performance
The performance impact of Network Load Balancing can be measured in four key areas:
- CPU overhead on the cluster hosts, which is the CPU percentage required to analyze and filter network packets (lower is better)
- Response time to clients, which increases with the non-overlapped portion of CPU overhead, called latency (lower is better)
- Throughput to clients, which increases with additional client traffic that the cluster can handle prior to saturating the cluster hosts (higher is better)
- Switch occupancy, which increases with additional client traffic (lower is better) and must not adversely impact port bandwidth
In addition, Network Load Balancing's scalability determines how its performance improves as hosts are added to the cluster. Scalable performance requires that CPU overhead and latency not grow faster than the number of hosts.
CPU Overhead
All load-balancing solutions require system resources to examine incoming packets and make load-balancing decisions, and thus impose an overhead on network performance. As previously noted, dispatcher-based solutions examine, modify, and retransmit packets to particular cluster hosts. (They usually modify IP addresses to retarget packets from a virtual IP address to a particular host's IP address.) In contrast, Network Load Balancing simultaneously delivers incoming packets to all cluster hosts and applies a filtering algorithm that discards packets on all but the desired host. Filtering imposes less overhead on packet delivery than re-routing, which results in lower response time and higher overall throughput.
Network Load Balancing's filtering algorithm runs in parallel on all cluster hosts. Filtering overhead can be measured as a percentage of the CPU used on all hosts. This overhead grows in proportion to the incoming packet rate (as does the routing overhead for dispatcher-based solutions) independent of the number of cluster hosts. For example, if a 2-host cluster experiences P percent CPU overhead per-host to sustain a given incoming packet rate, this percentage will remain the same for a 32-host cluster. If the packet rate doubles, the CPU overhead grows to 2P.
In practice, hosts are added to a Network Load Balancing cluster in proportion to the request rate as the client load increases. When this is the case, the CPU overhead grows linearly with both the packet rate and number of hosts. In the example used above, a 32-host cluster would experience a per-host CPU overhead of 16P to sustain a 16-fold increase in request-rate and throughput over a two-way cluster with CPU overhead P.
Network Load Balancing's CPU overhead has been measured for Web loads. The chart in Figure B.3 shows CPU overhead versus total throughput on a two-host cluster with 450-megahertz (MHz) CPUs. The Web load consisted of HTTP GET requests, with each request pulling a 10-KB static Web page. As an example, approximately 4.1 percent of each host's CPU (out of 45.7 percent total CPU per host) is required to filter 773 GET requests per second with 64.6 megabits per second (Mbps) throughput. This overhead, which is used to analyze and filter packets, was measured by setting the load percentage to zero on one of the two hosts and measuring the residual CPU percentage while the other host handled the entire load.
In Figure B.3, the CPU overhead required by Network Load Balancing to filter incoming packets is displayed as a function of the total throughput accessing 10-KB static Web pages in a 2-host cluster with 450-MHz CPUs.
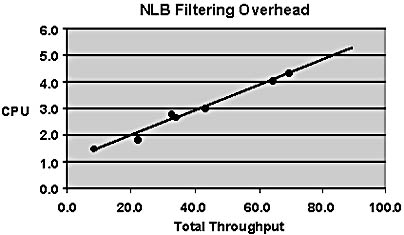
Figure B.3 NLB filtering overhead
The preceding figure shows that Network Load Balancing's filtering overhead grows linearly with packet rate as expected. At peak Fast Ethernet capacity of 100 Mbps, Network Load Balancing would require about 5.8 percent of a 450-MHz CPU to perform its packet filtering. Note that for multiprocessor hosts, this CPU percentage represents only a portion of the total CPU available on the host. Extrapolating from this chart, a cluster handling 250 Mbps total throughput would use 12.9 percent of a CPU on each host for packet filtering to serve 2,993 10-KB Web-page requests per second (or more than 258 million Web hits per day).
The ratio of CPU filtering overhead to throughput varies with the size and type of client requests. For example, at a given throughput level, GET requests for 1-KB Web pages will require more filtering overhead than do GET requests for 10-KB Web pages. Since Network Load Balancing's filtering overhead for tracking client connections is higher than for tracking packets within a connection, client requests that generate larger replies experience lower filtering overhead.
A second type of CPU overhead due to Network Load Balancing is its packet-handling overhead during data transfers, called transfer overhead. Because Network Load Balancing is implemented as an intermediate driver, it forwards all network packets flowing through the cluster adapter. This packet handling is heavily pipelined and adds very little latency to data transfers. Its CPU overhead is proportional to the packet rate for an individual host, not the total packet rate for the cluster. Hence, it remains fixed as cluster hosts are added in proportion to increases in client load.
Measurements of transfer overhead are shown in Figure B.4. Transfer overhead was measured by comparing the total CPU percentage for a system running Network Load Balancing to the total CPU percentage for a system with Network Load Balancing disabled and subtracting out the filtering overhead. As an example, in a 4-host cluster with 80 Mbps total throughput, each host would handle 20 Mbps throughput, which would require about 2.6 percent of the CPU.
The CPU overhead required by Network Load Balancing to transfer packets is shown as a function of the total throughput per host for accessing 10-KB static Web pages using 450-MHz cluster hosts.
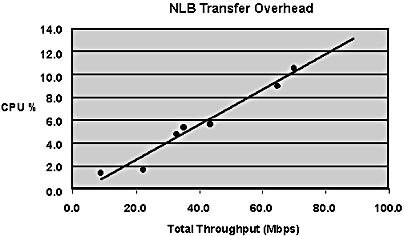
Figure B.4 NLB transfer overhead
It is useful to regard a cluster as a set of CPU "containers" that are available to handle client load. Network Load Balancing distributes incoming client load among these containers in order to distribute the CPU load as evenly as possible. It also requires a small amount of CPU in each container to accomplish the load balancing, and this amount increases in proportion to the packet rate (with filtering overhead increasing in proportion to the total packet rate and transfer overhead increasing in proportion to the per-host packet rate). The total number of hosts needed in the cluster depends on the speed of the hosts and the characteristics of the server application. CPU-intensive applications such as Web servers with Active Server Pages may require relatively large amounts of CPU per client request compared to Web servers pulling static Web pages. To meet CPU demand, they would handle less network traffic per host and require more hosts than would applications with lower CPU demand per client request. Figure B.5 below shows a cluster of CPU containers, each occupied in part by a server application load as well as the filtering and transfer overhead loads imposed by Network Load Balancing.
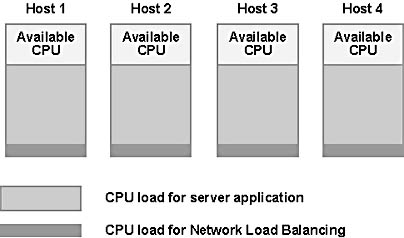
Figure B.5 CPU load distribution on cluster servers
Hosts are added to the cluster as needed to handle the CPU demand of client requests. Network Load Balancing uses a portion of the CPU on each cluster host for filtering and transfer overheads. Excess CPU capacity is reserved to handle extra client load in the event of host failures.
Throughput and Response Time
Network Load Balancing scales performance by increasing throughput and minimizing response time to clients. When the capacity of a cluster host is reached, it cannot deliver additional throughput and response time grows nonlinearly as clients awaiting service encounter queuing delays. Adding another cluster host enables throughput to continue to climb and reduces queuing delays, which minimizes response time. As customer demand for throughput continues to increase, more hosts are added until the network's subnet becomes saturated. At that point, throughput can be further scaled by using multiple Network Load Balancing clusters and distributing traffic to them using round-robin DNS. For example, this approach is used by Microsoft's Web site, Microsoft.com, which currently has approximately five 6-host Network Load Balancing clusters.
In practice, cluster hosts are added until all hosts are using a moderate amount of CPU at the anticipated request rate. Excess CPU capacity is maintained in each host to handle excess load after a failover. For example, the hosts for Microsoft.com typically run at about 60 percent of capacity so that they can handle host outages without difficulty.
All load balancers introduce overheads that impact throughput scaling and response time. For Network Load Balancing to scale application performance, it must not introduce bottlenecks that would constrain throughput as hosts are added. The overall throughput should increase linearly as hosts are added to the cluster and join in serving the client load. Network Load Balancing uses a highly pipelined implementation that minimizes the increase in response time, called latency, due to filtering and transfer overheads. As a result, only a small portion of Network Load Balancing's CPU overhead contributes to latency. The complexity of operating system interactions makes latency difficult to calculate directly. Preliminary measurements made during the previously described tests for accessing static, 10-KB Web pages indicated that the latency increase was approximately one percent of total response time (to receive the first byte of a GET request).
Network Load Balancing's latency and related CPU filtering overhead affect performance by eventually limiting the maximum possible throughput that can be obtained as packet rate increases. (CPU transfer overhead limits the peak throughput of a single host in comparison to a host with Network Load Balancing disabled but does not affect scalability.) Since a host's application service rate usually grows in proportion to its CPU usage, Network Load Balancing's CPU overhead has the effect of constraining the host's total throughput. Assuming that the client request rate grows with the number of hosts, throughput scaling for N maximally loaded cluster hosts is limited by growth in CPU filtering overhead. If R1 represents the maximum throughput on a single host, the maximum throughput per host in an N-host cluster can be calculated as:
RN = C * (1 _ (N * (RN / R1)*OF)) where R1 = C * (1 _ OF)
where OF is the CPU percentage required for Network Load Balancing to filter client requests at rate R1 and C is a constant relating service rate to its associated CPU usage. This filtering overhead grows with the increased request rate in proportion to the number of hosts (but limited by the feedback from RN / R1) and reduces each host's maximum service rate as hosts are added. Note that if OF = 0, the cluster produces linear N-fold increase in throughput, as expected. For applications with increasingly large CPU requirements per client request, Network Load Balancing will have lower CPU percentage overhead to sustain a given request rate, thus improving scalability as cluster hosts are added.
Figure B.6 below shows throughput scaling by plotting the formula above for maximum throughput versus the number of hosts for various filter overheads, including 0 percent overhead (which yields the ideal N-fold increase in throughput). Measurements of GET requests for 10-KB static Web pages indicate that a 450-MHz CPU saturates at an approximate request rate of 70.1 Mbps (836 requests/second) with about 4.4 percent CPU filtering overhead. As shown in the graph, throughput rolls off rapidly as hosts running at this request rate are added to the cluster. However, if the application consumes four times the CPU load per client request, Network Load Balancing's filtering overhead drops to 1.1 percent and throughput remains within 90 percent of the ideal N-fold throughput increase for 12 cluster hosts. With the same hosts, the request rate would be lower by fourfold. To maintain the request rate shown in the graph, four-way multiprocessor hosts could be used.
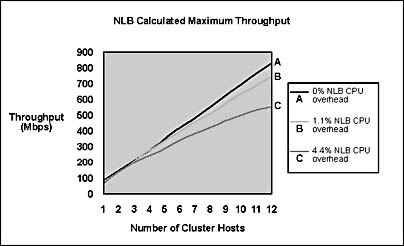
Figure B.6 Network Load Balancing calculated maximum throughput
Figure B.6 shows Network Load Balancing's calculated maximum throughput and comparison to ideal as cluster hosts are added. Throughput with 4.4 percent Network Load Balancing CPU overhead corresponds to a Web load of GET requests for 10-KB static Web pages using 450-MHz cluster hosts. Throughput with 1.1 percent Network Load Balancing CPU overhead corresponds to a fourfold increase in application CPU usage per client request and four-way symmetric multiprocessing (SMP) cluster hosts.
It is important to observe that the throughput curves above show the maximum throughput that can be achieved when all cluster hosts are saturated. This situation rarely occurs in practice because excess CPU capacity is always needed to handle extra client load after the loss of a cluster host. When the cluster runs at less than maximum throughput, Network Load Balancing's latency and CPU overhead do not reduce delivered throughput and the cluster exhibits linear throughput growth. For example, Figure B.7 below shows throughput measurements for a Web load of GET requests for 1-KB static Web pages. The graph follows the ideal N-fold growth in throughput as both packet rate and the number of hosts increases. The total CPU load for each cluster host was under 20 percent in these measurements.
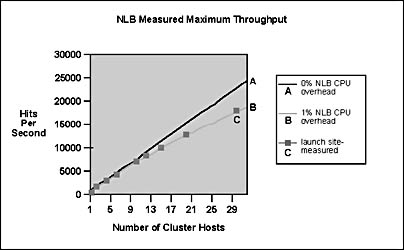
Figure B.7 Network Load Balancing measured maximum throughput
Figure B.7 illustrates Network Load Balancing's linear increase in throughput for Web load of GET requests for 1-KB static Web pages using 450-MHz hosts.
Network Load Balancing has been used to build clusters that generate very high throughput. In a recent demonstration (at the 1999 Comdex show in Las Vegas), Network Load Balancing was used to scale a Web site handling an e-commerce load. The site consisted of a Network Load Balancing cluster with six multiprocessor hosts connected to a back-end database cluster with two hosts. One hundred clients were used to generate an aggregate load of 1,600 GET requests per second (or 830 million requests per day). The site sustained a total throughput of more than 200 Mbps with 50,000 concurrent connections. This demonstration showed that Network Load Balancing provides the scaled performance needed to handle very large Web sites.
Switch Occupancy
Network Load Balancing's filtering architecture relies on the broadcast subnet of the LAN to deliver client requests to all cluster hosts simultaneously. In small clusters, this can be achieved using a hub to interconnect cluster hosts. Each incoming client packet is automatically presented to all cluster hosts. Larger clusters use a switch to interconnect cluster hosts, and, by default, Network Load Balancing induces switch-flooding to deliver client requests to all hosts simultaneously. It is important to ensure that switch-flooding does not use an excessive amount of switch capacity, especially when the switch is shared with computers outside the cluster. (Note that computers outside the cluster do not receive packets as a result of switch-flooding.) The percentage of switch bandwidth consumed by Network Load Balancing's flooding of client requests is called its switch occupancy.
For most Network Load Balancing applications, the bandwidth used for request traffic is a small fraction of the total bandwidth needed for client/server communication. Figure B.8 below shows the percentage of each 100-Mbps switch port consumed by client GET requests for 10-KB Web pages at various throughput rates. The chart confirms that client requests use less than 2 percent of switch bandwidth for this Web load.
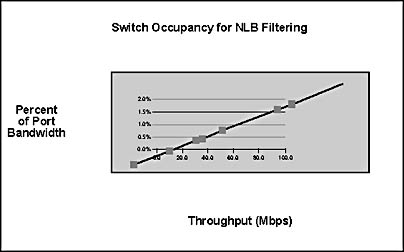
Figure B.8 Switch occupancy for NLB filtering
Figure B.8 shows the percentage of a 100-Mbps switch port used by client GET requests for 10-KB static Web pages.
Switch-flooding can become a problem in applications with a significant percentage of network traffic directed to the cluster (such as file uploads in FTP applications). It can also become a concern when multiple clusters share a switch and their combined flooding becomes significant. Finally, if a switch is configured to use ports to connect to the backbone network that have a higher speed than those used to connect to cluster hosts, switch occupancy can become prohibitively high. For example, if the switch uses gigabit ports to connect to the backbone and 100-Mbps ports for the cluster, switch occupancy can increase by a factor of 10. In the example above, at 500 Mbps total bandwidth, switch occupancy would increase to 10 percent. In these cases, running Network Load Balancing in multicast mode and setting up a virtual LAN in the switch can limit switch-flooding.
EAN: N/A
Pages: 183