Monitoring Disk Efficiency
Along with disk capacity, you should consider disk throughput when evaluating your starting configuration. Use the bus, controller, cabling, and disk technologies that produce the best throughput that is practical and affordable. Most workstations perform adequately with the most moderately priced disk components. However, if you want to obtain the best performance, you might want to evaluate the latest disk components available.
If your configuration contains different types of disks, controllers, and buses, the differences in their designs can have an influence on throughput rates. You might want to test throughput using these different disk systems to determine if some components produce less favorable results overall or for certain types of activity, and replace those components as needed. In addition, the use of certain kinds of volume-set configurations can offer performance benefits. For example, using stripe sets can provide better performance because they increase throughput by enabling multiple disks to service sequential or clustered I/O requests. System Monitor supports monitoring volume sets with the same performance objects and counters provided for individual disks. Notice that hardware-based RAID devices report all activity to a single physical disk and do not show distribution of disk operations among the individual disks in the array. For more information about using striped volumes, see Windows 2000 Help.
Be aware of the seek time, rotational speed, access time, and the data transfer rate of your disks by consulting manufacturer documentation. Also consider the bandwidth of cabling and controllers. The slowest component determines the maximum possible throughput, so be sure to monitor each component.
To compare the performance of different disks, monitor the same counters and activity on the disks. If you find differences in performance, you might want to distribute workload to the better performing disk or replace slower performing components.
Preparing for Comparison Testing
If you want to know more about the volume and rate of activity through the disk system, monitor the reading and writing activity as described in the following sections. Before you begin to test disk efficiency, complete the following steps to ensure valid results:
- When testing disk performance, log performance data to another physical disk or computer so that it does not interfere with the disk you are testing. If you cannot do this, log to another logical volume on the drive, or measure monitoring overhead during an idle period and subtract that overhead from your data to ensure your results include only disk-specific data and not overhead from other activity.
- Monitor individual instances whenever practical. Summed values and the _Total instance can provide overstated values. For more information about interpreting counter data, see "Working with Disk Counters" earlier in this chapter.
- Remember to defragment your disk before testing. If your disk is nearly full, the remaining free space is likely to be fragmented, which adds to the seek time of I/O write operations as the disk looks for each sector of free space.
- Ensure that disks being monitored are not compressed or encrypted, to avoid having these features add overhead during monitoring. However, if you plan to use these features, testing performance with the features deployed can yield results that are more representative of your production environment.
The following are suggested tests to perform to learn about your disk system's performance.
Testing Maximum Throughput
A maximum throughput test tells you about one of the limits of your system. To conduct a maximum throughput test, you can use one of the request-generation programs that are publicly available on the World Wide Web. Use the following counters on the PhysicalDisk and LogicalDisk objects for this test:
- Avg. Disk Read Queue Length
- Avg. Disk Bytes/Read
- Avg. Disk sec/Read
- Disk Read Bytes/sec
- Disk Reads/sec
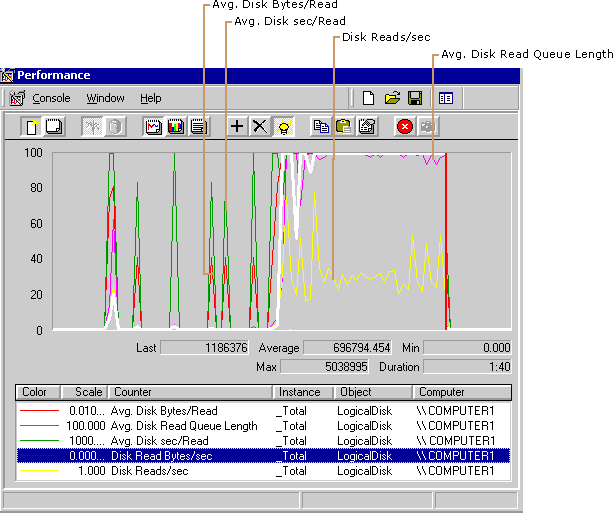
Figure 8.3 illustrates a test of maximum throughput. Notice that the values for Disk Read Bytes/sec and Avg. Disk Read Queue Length become extremely high in this graph.

Enlarge figure
Figure 8.3 A Disk Reaching Maximum Throughput
After you determine the maximum throughput for your disk, you can adjust the load on your disk so it does not become a bottleneck.
Testing Reading vs. Writing
Some disks and disk configurations perform better when reading than when writing. You can compare the reading and writing capabilities of your disks by reading from a physical disk and then writing to the same physical disk. To measure reading from and writing to disk, log the Logical and Physical Disk objects in System Monitor, then chart the counters shown in Table 8.2.
Table 8.2 Counters for Measuring Reading and Writing
| For information on | Counters for reads | Counters for writes |
|---|---|---|
| Average size of the request | Avg. Disk Bytes/Read | Avg. Disk Bytes/Write |
| Average duration of the request | Avg. Disk sec/Read | Avg. Disk sec/Write |
| Rate of transfer for the type of request | Disk Read Bytes/sec | Disk Write Bytes/sec |
| Rate at which requests are processed | Disk Reads/sec | Disk Writes/sec |
You might see some variations in the time it takes to read from or write to disk on standard disk configurations. For example, disks with fast write caches can complete write operations very quickly if there is sufficient idle time between random writes. Also, if reads are sequential, read operations might also occur very quickly, provided the disk has had time to prefetch data. Prefetching data is the process whereby data that is expected to be requested is read ahead into the onboard cache.
On RAID 5 volumes and stripe sets, reading is faster than writing. When you read, you read only the data; when you write, you read, modify, and write the parity, as well as the data. The exception to this rule is full-stripe writes. If entire stripes are being written, there is no need to read the old data or parity.
Mirrored volumes also are usually faster at reading than writing, and are faster at writing than RAID 5 volumes. When a mirrored subsystem gets a read request, it chooses one of the two or more disk sources to service the request, in a round-robin fashion, or based on disk utilization.
When you start writing to the disk during a read operation that you are monitoring, you will notice some dips in the curves of graphed data for read activity. This is because the application doing the reads must stop briefly to allow the write operation to proceed and then, when the write is finished, the read operation resumes. You can observe this as Performance Logs and Alerts service logs data.
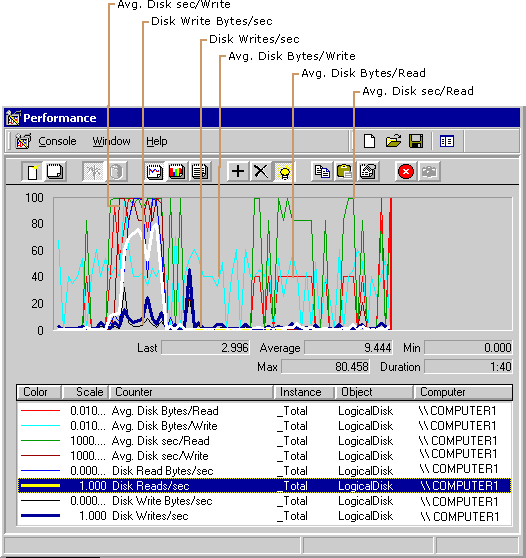
Figure 8.4 shows the effect of writing on the efficiency of the reads. Notice how the increase of reading activity is accompanied by a slight decrease in writing.

Enlarge figure
Figure 8.4 How I/O Operations are Affected by Competing Activity
© 1985-2000 Microsoft Corporation. All rights reserved.
EAN: N/A
Pages: 404