Lesson 3: OLAP Services and PivotTable Service Architecture
The Microsoft SQL Server OLAP Services Architecture includes server-side components such as the online analytical processing (OLAP) Server for building cubes. The client also contains some components, the most important of which is the PivotTable Service.
The PivotTable Service is a client-side component that allows a user to access multidimensional data. The PivotTable Service connects to the OLAP Server on the server, which makes calls to the multidimensional data. The data is returned to the client, and the PivotTable Service allows the user to browse the data.
After this lesson, you will be able to:
- Describe OLAP Services client-server architecture
- Describe the OLAP Services client-server cache
Estimated lesson time: 60 minutes
Microsoft SQL Server OLAP Services Architecture
The OLAP Services architecture facilitates access to cube data by allowing OLAP clients to communicate with an OLAP Server. Figure 10.7 shows the client and server components of this architecture.
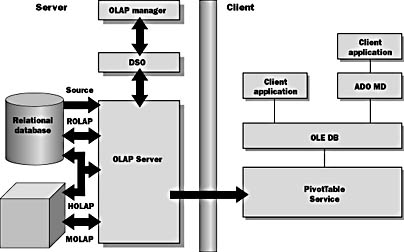
Figure 10.7 OLAP Services architecture
Server Components
OLAP Services architecture includes server-side components for building and storing cubes. The principal component is the OLAP Server, which processes cubes, manages storage, and presents query results to clients. The OLAP Server can store data in a relational database or in multidimensional data storage.
Decision Support Objects (DSO) is the administrative applications program- ming interface (API) for the OLAP Server. Applications can use DSO to build and maintain cubes on the OLAP Server. The visual tool, OLAP Manager, uses DSO to communicate with the OLAP Server.
Client Components
The PivotTable Service is a client-side component that allows client access to multidimensional data. The PivotTable Service makes calls to the multidimensional data on the OLAP Server and presents the data to the client. The PivotTable Service can also cache multidimensional data (in memory and on disk) and allow clients to browse the data locally.
Client applications can access the data provided by the PivotTable Service through OLE DB for OLAP or through an application that uses Microsoft ActiveX Data Objects (multidimensional), or ADO MD, to access OLE DB. Each client interface allows you to
- Connect to an OLAP Server
- Browse multidimensional schema
- Query a cube and retrieve the results
Administrative Interface for OLAP
Decision Support Objects (DSO) is the administrative interface for the OLAP Server. Your applications can use DSO to control the OLAP Server as well as create and maintain cubes on the OLAP Server. Figure 10.8 shows the DSO object model.
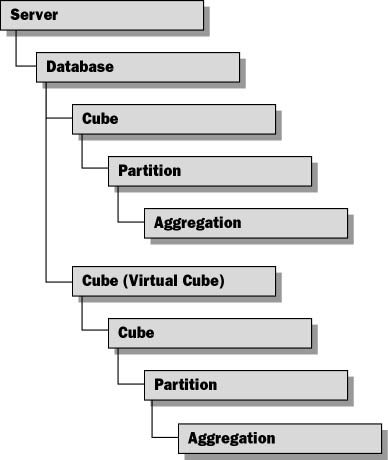
Figure 10.8 The Decision Support Objects object model
Using DSO Object Hierarchy
DSO objects represent the metadata of an OLAP database and the cubes that an OLAP Server manages. DSO uses an object hierarchy to define OLAP data elements:
- The server object contains groups of objects that define databases that the server manages.
- Each database element can contain groups of objects that define cubes or virtual cubes.
- A cube contains one or more partitions, which contain aggregations.
- A virtual cube combines data from other cubes, similar to the way that a relational database view combines portions of tables.
Using DSO in Applications
You can develop DSO applications in Microsoft Visual Basic and other languages that support the Component Object Model (COM). Since OLE DB for OLAP and ADO-MD are well-optimized data access interfaces for OLAP Services, you should not use the DSO object model to create data analysis applications. Use DSO to create administrative applications. The DSO model facilitates building server-side applications by providing objects, properties, and methods to
- Connect to an OLAP Server
- Create a new OLAP database to contain cubes
- Add a data source that contains the data
- Create a cube and specify dimensions, measures, and levels
- Process a cube to load the structure with data
NOTE
Additional information on DSO can be found in SQL Server OLAP Services online documentation by searching on "Using Decision Support Objects" or "Creating a Sample Program Using Decision Support Objects."
PivotTable Service
The PivotTable Service is a client-side component that allows the user to access OLAP Server data. The PivotTable Service includes a number of features such as smart caching and local cube persistence.
Any ActiveX client can use the PivotTable Service. This service allows multidimensional data to be used in Microsoft Office products and custom applications.
The PivotTable Service
- Connects to the OLAP Server as a client.
- Provides an interface to OLAP Server data so that you can analyze data stored on the server.
- Offers access to multidimensional data managed by the OLAP Server and to relational data sources.
- Allows cube data to be stored locally on the client computer. Client applications can, therefore,
- Create a local cube directly from a relational data source
- Copy an entire cube or a slice (subset) of a server cube and store the cube on the local computer for offline analysis. In this case, the PivotTable Service acts as a local OLAP Server.
- Provides client cache management for cube data.
- Allows you to use multidimensional expressions (MDX) to retrieve and manipulate cube data as well as to define and populate local cubes.
PivotTable Service Architecture
PivotTable Service is an OLE DB provider that supports OLE DB for OLAP and provides multidimensional extensions (MDX). Figure 10.9 shows how the PivotTable Service provides a standard interface for client applications to use OLAP Services.
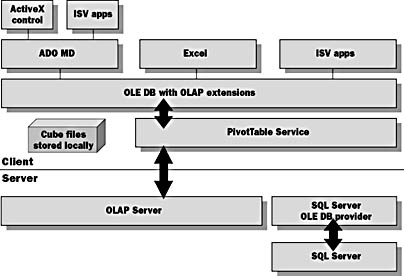
Figure 10.9 PivotTable Service architecture
Client Component of Microsoft Office 2000
PivotTable Service, spreadsheet, and chart components are delivered as Web-based components and provide the functionality of Microsoft Excel in Microsoft Internet Explorer. These components can be associated with a variety of data sources, including Excel, Microsoft Access, SQL Server 7.0, and OLAP Services. You can access information edit, and manipulate the data by using these components.
Create Local Multidimensional Cubes
PivotTable Service can create a data cube and load data from an OLE DB rowset provider or a SQL relational database. A cube is usually composed of a measure (or fact) table, which contains a value of the measure for each combination of values for the dimensions, as well as one or more dimension tables, each of which defines the values of a dimension. Together, the fact table and dimension tables represent the star schema (or snowflake schema) commonly used in OLAP processing.
Excel 2000 provides an option in the Client-Server Settings dialog box on the PivotTable toolbar to choose a local data file in which to build the cube. If the local file does not exist, the PivotTable Service uses OLAP Services to create the file. When you create a local cube file, you can keep using the PivotTable or PivotChart after you disconnect from the OLAP Server and you can create new PivotTables or PivotCharts that use the local cube file as the data source.
Excel 2000 can create local cube files from OLAP Services data sources only. Microsoft English Query provides a wizard for creating local cube files from other data sources.
Direct Connection to the OLAP Server
When PivotTable Service is used with OLAP Services, it automatically apportions processing and caching to the most appropriate locations and enables multiple clients to access the same cubes dynamically.

Exercise 1: Creating a Local Cube File
In this exercise, you will save a slice of the cube locally.
- In Excel, open the C:\SQLDW\Exercise\Ch10\Pivot.XLS workbook that you created in the previous exercise. Switch to the spreadsheet view showing the data on Sheet4.
- On the PivotTable toolbar, click the PivotTable button. Then select Client Server Settings....
- Click the Create local data file button.
- On the Welcome page of the Create Cube File Wizard, click Next.
- In step 2 of the wizard, for each dimension in your server data, choose the levels that you want to include in the local cube file. Check every level shown. When you check levels, ensure that the name of the level appears in bold text; if it is normal text, check it again. A level that is checked but appears in normal text has only some of its sublevels selected. Click Next.
- In step 3 of the wizard, for each top level you want to include in the local cube file, choose the items that you want to include from that level.
- If necessary, navigate to C:\SQLDW\Exercise\Ch10 and type Sales.cub for the name of the cube file.
- Click Finish to create the cube file.
- In the Client Server Settings dialog box, note that the Local data file option is now selected. Click OK.
- Click OK in the warning dialog boxes.
- Close the workbook. Do not save the workbook.
The Client Server Settings dialog box appears. The Server-based data option is selected, showing you that the PivotTable Service is currently using data on the OLAP Server.
Check Measures, Employee Name, Category Name, and Shipper Name. Expand Country and check USA only. Expand Year and check 1997 only. Then click Next.
A dialog box tells you that the organization or content of the cube has changed.
Calculated Members Are Not Transferred by the Create Cube Wizard
The warning message in step 9 of the exercise occurs because Discounted Line Total is a calculated member. Calculated measures are not transferred from server cubes when you create local cubes by using the Create Cube File wizard. You can create calculated members when you create local cubes programmatically. Your worksheet is using the Discounted Line Total in the PivotTable, so the local cube file cannot be used for your PivotTable. If you remove the Discounted Line Total from the PivotTable, you can use the local cube file with this worksheet.
You will learn how to create local cubes file programmatically in Chapter 12, "MDX Statements and ADO MD Objects."
Exercise 2: Connecting to a Local Cube File
In this exercise, you will connect to the local cube created in the last exercise.
- On the File menu, click New.
- In the New dialog box, click OK to create a new workbook.
- On the toolbar, click the Save button. Save the file to C:\SQLDW\Exercise\Ch10\LocalCube.XLS.
- On the Data menu, click the PivotTable and PivotChart Report menu option.
- Under Where is the data you want to analyze? click External data source. When asked what kind of report you want to create, select PivotTable. Click Next.
- In step 2 of the wizard, Excel needs to know where the data is located. Click the Get Data button.
- Click the OLAP Cubes tab.
- Choose <New Data Source> from the list, and then click OK.
- This opens the Create New Data Source dialog box. In the first field, type Northwind_Sales_Local_Cube for the name of your data source.
- In the next field, choose the OLAP Services provider, Microsoft OLE DB Provider for OLAP Services, from the drop-down list.
- Click Connect. The Multi-Dimensional Connection dialog box opens.
- Click Cube File, and in the File field, type C:\SQLDW\Exercise\Ch10\Sales.cub
- Click Finish.
- Click OK.
- Click OK. This returns you to the PivotTable and PivotChart wizard in Excel. You will see the text "Data fields have been retrieved" next to the Get Data button.
- Click Next.
- This takes you to the third and final step in the PivotTable and PivotChart wizard. Click New worksheet to put the PivotTable on a blank worksheet.
- Click Finish.
- You are now connected to a local cube and working off line. Use the PivotTable to query the data and build charts from the data as you did in previous exercises.
This opens the PivotTable and PivotChart Wizard dialog box.
At this point, Excel calls Microsoft English Query to retrieve the data. The Choose Data Source dialog box opens, listing the current databases registered on your computer.
This returns you to the Choose Data Source dialog box, where the Northwind_Sales_Local_Cube data source is selected.
You will briefly see the message Connecting to Data Source in the Excel status bar, and then the PivotTable toolbar will be displayed over the PivotTable workspace.
You can continue to work against the current data. When you are back on line and can connect to the OLAP Server, then you can refresh the data to pull down the updated data set that matches the current definition of the local cube. Or you can redefine the definitions of the local cube. Do this by switching between the server and the local cube or by editing the local cube. Use Client Server Settings on the PivotTable toolbar to perform these operations.
Exercise 3: Connecting to an OLAP Cube from a Web Page
In this exercise, you will use the Office 2000 PivotTable Web component to connect to the Sales cube stored on your OLAP Server.
- On the Start menu, point to Programs, point to Accessories, and then click Notepad.
- In this exercise, you will use a pre-built Web page. On the File menu, click Open. Browse to the C:\SQLDW\Exercise\Ch10 folder and open the O2KWebComponent.HTM file.
- The Microsoft ActiveX control has already been declared for you within the page. You should see the <OBJECT> tag, which inserts the PivotTable Web Component with an ID of PivotControl. You will add the code that sets properties in the control to connect to the Sales cube and set up the control to use specific dimensions and measures when loading.
- In the file, find the LoadControl procedure that has already been declared but contains no code.
- Type the following lines of code within the procedure. If you prefer not to type this code, you can copy and paste it from C:\SQLDW\Exercise\Ch10\Code.TXT.
- On the File menu, click Save so that the new changes will take effect.
- Open Microsoft Internet Explorer and select Open on the File menu. Type the filename C:\SQLDW\Exercise\Ch10\O2KwebComponent.HTM and click OK.
- The PivotTable Web Component shows the Sales cube data with the Customer dimension for the columns and Product dimension for the rows. The Discounted Line Total measure is shown in the data section of the grid.
On Error Resume Next PivotControl.MemCheck On Error Goto 0 PivotControl.ConnectionString = "PROVIDER=MSOLAP;" & _ "DATA SOURCE=<Your Server Name Here>; INITIAL CATALOG=Northwind_DSS;" PivotControl.DataMember = "Sales" Set view = PivotControl.ActiveView view.ColumnAxis.InsertFieldSet view.FieldSets("Customer") view.RowAxis.InsertFieldSet view.FieldSets("Product") view.ColumnAxis.DisplayEmptyMembers = 0 view.RowAxis.DisplayEmptyMembers = 0 view.DataAxis.InsertTotal view.Totals("Discounted Line Total") On Error Resume Next PivotControl.MemCheck On Error Goto 0 |
Make sure that you type your server name where indicated in the code.
The component loaded in the Web page has many features that allow an end user to work with the data easily and effectively. You will use some of these features of the component to manipulate the data and export it to Excel. Although the component highly resembles the Excel PivotTable component, it is not the same control. The Excel PivotTable component and the Web component are different components that both use the PivotTable Service as the lower-level communication layer to interact with the OLAP Server and retrieve the data.
- On the component, click the Field List toolbar button.
- Select the Time dimension in the list. Then, select Filter Area in the drop-down list located at the bottom of the Field List dialog box. Now click the Add to button.
- Close the Field List dialog box.
- In the Time dimension drop-down list located in the top portion of the component, check the 1998 check box and clear the 1996 and 1997 check boxes.
- The data reflects the total of all discounted line items by customer and product for the year 1998.
- At this point, you want to export the data to Excel. Click the Export to Excel toolbar button.
- Excel is loaded with the current PivotTable settings and the data from the OLAP Server. You can now perform the same functions as you did in previous exercises.
OLAP Services: Client/Server Cache
OLAP Services is able to cache query results and metadata, not disk pages. This allows OLAP Services to respond to queries or even perform some aggregations without having to go back to the cube.
The PivotTable Service works with OLAP Services to cache information on the client. This means that data can be read from the local cache without having to go back to the server.
These two caches one on the OLAP Server, the other on the client make queries as efficient as possible, minimizing the work that the server does to answer queries and minimizing the amount of network traffic generated by OLAP queries.
Algorithms Deduce Missing Data and Transform Queries
If the base data is available on the client, OLAP Services can perform some calculations without returning to the server. For example, it can perform the following actions against locally cached data:
- Aggregation
- Filtering
- Combination
If monthly data were already in cache, and the user asked for quarterly data, the monthly data could be aggregated into quarterly data.
If the data for the entire United States was already in cache, and the user asked to see the data for one region of the country, the data could be filtered out of the data already in cache.
If the cache contains the data for 1998, and the user asks for 1997 and 1998 data, OLAP Services will need to retrieve only the 1997 data from the cube. It will then combine it with the 1998 data in the cache.
Instant Reply to Cached Queries
Queries that seek data that is already in cache will have the data returned instantly, because OLAP Services will not need to read the data from the cube.
Client/Server Cache: A Simple Example
The client/server cache is a part of the PivotTable Service.
In Figure 10.10, the client makes a request for the Jan98, Feb98, and March98 data, and the server sends this data to the cache on the client computer.
The client then asks for the first quarter 1998 (Q198) total sales. The PivotTable Service recognizes that this data is in the local cache, so it calculates the number dynamically, without going back to the server.
Finally, the client asks for the Q198 and Q197 sales. The PivotTable Service realizes that it can calculate the Q198 information from what is in the local cache, so it retrieves only the Q197 data from the server.
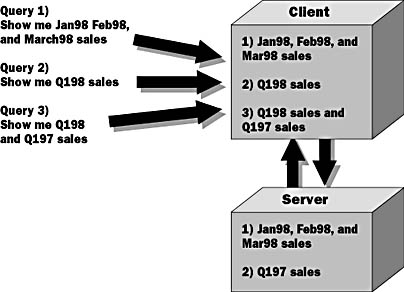
Figure 10.10 A simple example of the client/server cache
Client/Server Cache: Multiple User Example
In Figure 10.11, the first user requests product sales in European countries. OLAP Services takes this information from the Europe partition of the Sales cube. This information is placed in the cache on the server as well as in the local cache on the first user s machine.
The second user requests sales data for both the United States and Asia. OLAP Services reads data from both the USA partition and the Asia partition. This information is also cached on the server as well as on the machine of User 2.
User 1 now requests data that is a subset of the data in the local cache when he asks for product sales in Italy (a subset of Europe). Because the European data is in his local cache, the query does not have to go to the server at all. His query is returned from the local cache.
Finally, User 1 wants to look at product sales in the United States, Asia, and Europe. The European data is already on User 1 s local machine, so the PivotTable Service goes to the server looking for the USA and Asia data. This data is in the server cache, so OLAP Services returns this data without having to go back to the original multidimensional data.
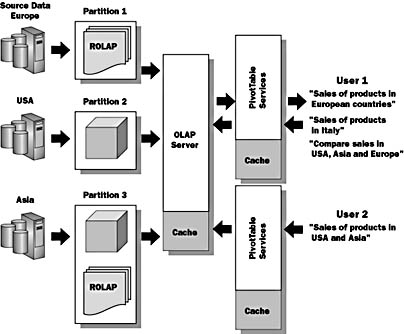
Figure 10.11 Multiple user example of the client/server cache
Lesson Summary
The Microsoft SQL Server OLAP Services architecture provides a standard mechanism for implementing online analytical processing for a data warehouse. The server components provide multidimensional database management, caching, and an interface for any OLE DB for OLAP client. PivotTable Service is a client to OLAP Services that can connect to the OLAP Server, provide client caching or use, and manage a local cube file. PivotTable Service is an OLE DB for OLAP provider that can be easily accessed by applications using ADO MD.
EAN: 2147483647
Pages: 114