Lesson 2: OLAP System Design
Normalized E-R models are often not well suited to addressing the needs of a business. Business information can be requested at the detail or summary level. Summary-level information often provides input to the strategic direction of the business. In many cases, you can identify important business information by determining the business questions that are asked by managers and finding out how those questions are answered. These business queries may be satisfied by a simple set of criteria, which is often visualized as a three-dimensional cube. A cube is not limited to three dimensions; hypercubes of greater than three sides are also possible. In this lesson you will learn about dimensional models, which meet these business information requirements.
After this lesson, you will be able to:
- Describe the design characteristics of online analytical processing (OLAP) systems
Estimated lesson time: 20 minutes
Business sees information in the context of answers to questions. Figure 4.3 illustrates the business perspective on information. Information is often categorized according to criteria, as in this example by product type (Cherries) and city (Detroit). It is often summarized, as in this example by quarter (Q4). Even more significant, it is often considered in a time series.
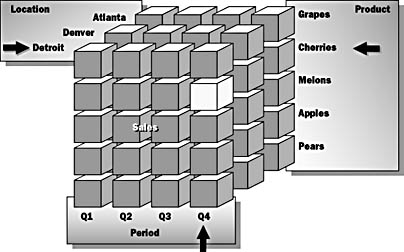
Figure 4.3 How the business looks at information
Businesses need a multidimensional view to answer complex questions, such as:
- What was the sales volume for cherries in Denver during the second quarter?
- How did the sales activity in Detroit change between Quarter 1 and Quarter 3 for all products except apples?
- What product has the highest sales volume in each of the locations during Quarter 4?
The answers to these questions are answered by metrics. A metric is a measurable or quantitative value.
There are many non-metric-based questions that can be asked of the data. The multidimensional approach would not be the first choice if your business asks analytical questions that are not answered by metrics. Questions that are not answered by metrics typically require an answer that is a list of items rather than a numeric value. For such questions, you must fall back on the relational approach of retrieving this information through a series of queries against the dimension tables. For example:
- Who were the first 10 employees hired during the first quarter last year?
- Which products did we add to our inventory this year?
- Who were the parties involved in the car wreck on claim number 43031A?
Designing OLAP Systems
Multidimensional OLAP systems provide a business-oriented solution for answering complex questions. This approach is highly successful when the answers are most often composed of metrics or quantitative data. A different design approach is needed to address the analytical information needs of the business. This approach is characterized by four qualities: a logical design technique for analytical querying; a predictable, standard framework; ability to withstand unexpected changes in user behavior; and existing queries and applications are unaffected by system changes.
Logical Design Technique for Analytical Querying
- Presents the user with a view of data that is more consistent with business processes. For example, using graphical elements such as charts and descriptions instead of cryptic column names.
- Enables high-performance analysis of large segments of information.
Predictable, Standard Framework
- Dimensional models define the business dimensions of the information. Dimensions are the criteria used to analyze the business information, for example, customer demography, time, or product range.
- Query tools and user applications can make strong assumptions about the structure.
- Enables efficient searches using bit vector indexes.
- Allows the database engine to establish an efficient query strategy.
Withstanding Unexpected Changes in User Behavior
- Establishes multiple equivalent entry points into the analytical environment. For example, a user may wish to access information by customer, by product, or by date. Performance for any of these access methods should be similar.
- Design is independent of expected query patterns. Rather than design a database that favors one type of query, an analytical database design will be balanced and will respond equally well to any type of query.
- User interfaces, query strategies, and generated SQL are symmetrical. In other words, the architecture supports access equally well from different tools. The user need not be technically proficient to use the analytical tools effectively. Neither is one type of tool better performing than another. For example, a graphical query tool has as many features and as good performance as a text-based query tool.
Existing Queries and Applications Are Unaffected by System Changes
The design is not affected when
- New metrics, information objects, or attributes are added to the analytical environment
- Information objects are represented at a lower level of granularity in the analytical environment (from a point in time forward)
Dimensional Modeling: The Star (Join) Schema
Figure 4.4 introduces the table schema design approach used for OLAP. This table schema creates a multidimensional information structure that is compatible with business needs.

Figure 4.4 Dimensional modeling: The star schema
The star schema approach was developed to resolve issues surrounding the use of normalized E-R models for business information databases. The name comes from the similarity of the schema s diagram to a star. Star schemas have these characteristics:
- The center of the star is the fact table (Sales).
- Fact tables contain the key performance indicators (KPIs) that pertain to a combination of information objects and time.
- The KPIs are the attributes of the fact table.
- The information objects and time are elements of the primary key.
- The points of the star are the dimension tables (Product, Organization, Store, and Time).
- Dimension tables contain data about information objects or time.
- Fact and dimension tables are joined together through the multipart primary key in the fact table.
- Each dimension table is directly related to the fact table by a key column.
- The star schema is implemented using relational database technology.
In rare cases, a primary key element of a fact table may not be supported by a dimension table (this is called a degenerate dimension).
NOTE
A star schema may have as many "points" (dimensions) as necessary. It is not limited to a five- or six-point form.
Dimensional Hierarchies
It is common for business categories to be hierarchical in nature. In other words, criteria can be grouped at a higher level. These levels contain subcategories, each of which contains their own subcategories. These hierarchies define "drill-up" and "drill-down" paths for query navigation. A dimensional hierarchy is an arrangement of members of a dimension into levels based on parent-child relationships, such as Year, Quarter, Month, Day, or Country, State, and City. Members in a hierarchy are arranged from general to more specific. For example:
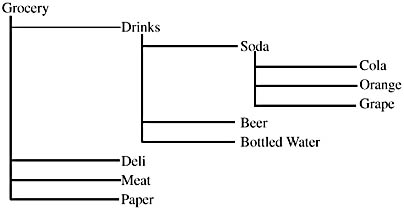
- The Grocery department can have many categories (such as Drinks, Deli, Meat, and Paper).
- A specific category, Drinks, can have many subcategories (such as Soda, Beer, and Bottled Water).
- A specific subcategory, Soda, can have many products (such as Cola, Orange, and Grape).
Here is the hierarchy in outline form:
Care must be taken to segregate incompatible hierarchies. For example, Sales and Manufacturing may have independent hierarchies that both include the same entity, such as product:
- Sales may categorize products in a hierarchy by region/territory/sales manager.
- Manufacturing may categorize products in a hierarchy by supplier/distributor/channel.
Depending on the application, you may want to represent these hierarchies by different dimensions, but it is more common to have different attributes within the same dimension.
Dimensional modeling provides two approaches: consolidated dimensional hierarchies and snowflaked hierarchies.
Consolidated Dimensional Hierarchies
Consolidation is an example of how denormalization is applied in dimensional models. Consolidation involves embedding the entire hierarchy in the dimension table as shown in Figure 4.5.
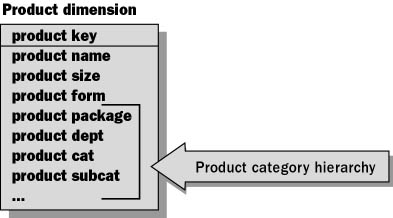
Figure 4.5 Consolidated dimensional hierarchies
Here the product example is consolidated:
- Each level of the hierarchy is represented by a separate attribute (product department, product category, and product subcategory).
- This represents the simplest structure for querying.
- It will result in additional storage consumption (over a normalized approach).
As in the rest of the table, these attributes contain textual descriptors.
Users can access data using a single table rather than needing to know the names of multiple hierarchical tables.
There will be repeated values in a table with a consolidated hierarchy. Compared with the storage required by the fact table, the increase is nominal. Here is a sample table showing a consolidated hierarchy:
| Country | Region | City | Customer |
|---|---|---|---|
| USA | OR | Elgin | Hungry Coyote Import Store |
| USA | OR | Eugene | Great Lakes Food Market |
| USA | OR | Portland | Lonesome Pine Restaurant |
| USA | OR | Portland | The Big Cheese |
| USA | WA | Kirkland | Trail's Head Gourmet Provisioners |
| USA | WA | Seattle | White Clover Markets |
| USA | WA | Walla | Walla Lazy K Kountry Store |
| USA | WY | Lander | Split Rail Beer & Ale |
Snowflaked Hierarchies
A snowflake schema is an extension of a star schema such that one or more dimensions are defined by multiple tables. In a snowflake schema, only primary dimension tables are joined to the fact table. Additional dimension tables are joined to primary dimension tables. Figure 4.6 illustrates a dimension with a snowflaked hierarchy. Snowflaking is more closely related than a star schema is to techniques used in normalization. Snowflaking gets its name from the image that results when you add the hierarchical table extensions to the star schema diagram. In Figure 4.6, the product hierarchy example is snowflaked.
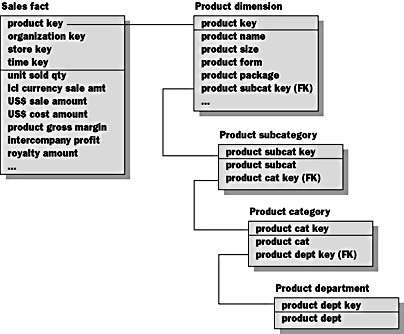
Figure 4.6 Snowflaked hierarchies
- The textual attributes for the product subcategory, product category, and product department have been split out into separate tables.
- The primary key of each table is an artificially assigned key rather than a natural key such as a product code. Most relational database systems provide a mechanism for generating artificial key values automatically. In SQL Server, you can generate artificial key values by creating an identity column for a table.
- The product subcategory primary key is included as a foreign key attribute in the product dimension.
- The product category primary key is included as a foreign key attribute in the product subcategory dimension.
- The product department primary key is included as a foreign key attribute in the product category dimension.
- This structure may require several joins to apply a specific textual constraint to a query.
Consolidated vs. Snowflaked Hierarchies
The following table compares the consolidated and snowflake hierarchy modeling approaches.
| Criteria | Consolidated | Snowflaked |
|---|---|---|
| Overall row count/space required | Higher | Lower |
| Model understandability | Easier | More difficult |
| Number of tables | Less | More |
| Query complexity | Simple | More complex |
| Dimensional searching | Quicker | Slower |
| Bitmapped indexing | Supports | Inhibits |
Snowflaked Approach
Unless absolutely necessary, snowflaking should be avoided. Although the snowflaked approach results in a lower overall row count, the disadvantages often outweigh the benefits.
Consolidated Approach
This approach results in a higher overall row count, but it does provide benefits:
- With fewer tables involved, queries are simpler to construct.
- Because no join is required to access textual values, searches for attributes on which to constrain are quicker.
- It supports the use of bitmapped indexing.
- Database design is more easily comprehended.
- More tools are available that can use the star schema (consolidated approach) than the snowflake schema.
Information Object Dimension Tables
Figure 4.7 introduces the characteristics of the information object dimension tables of the schema. First, examine three of the points of the star (all except the time dimension, which is a special case). These are the information objects identified during the requirements-gathering process.
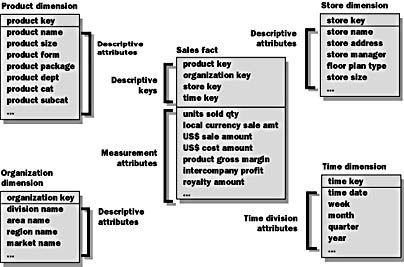
Figure 4.7 Information object dimension tables
These points of the star are used to describe the information objects that exist within a specific business process in this case, retail sales.
Each of the dimension tables share the following characteristics:
- Contains descriptive, textual information (like description, name, size, address, and others)
- Is used as source of constraints
- With store size > 12000 (sq. ft.)
- With product brand = Borden
- Is almost always the source of row headers
- Product key detail line
- Product dept minor break line
- Store name major break line
- Contains entry points into the fact table
- Scan dimension tables for potential constraints
- Select constraints
- Issue query against fact table
Time Dimension Table
Regardless of the process being represented, this is the one dimension that is virtually guaranteed to be present in every star. It provides the historical element to the warehouse. The time key may (or may not) store date values. It could represent a month, fiscal period, or some other time division.
The time dimension has the following characteristics:
- The attributes specify time divisions or events, such as months, quarters, seasons, or festivals.
- It is commonly used to constrain the date, month, or year when performing analysis, for example, analyzing sales figures for 1998.
- It is also useful for identifying special times (like workdays, weekends, holidays, seasons, fiscal periods, and others).
Fact Table
The fact table is the target of all analytical queries. While the dimensions provide constraints, the fact table provides the answers. The fact table has the following characteristics:
- Contains business metrics (facts).
- Represents an observation in the marketplace.
- Is derived from KPIs.
- The most useful attributes are numeric and additive.
Additivity is crucial because decision support applications rarely retrieve a single fact table record; rather, they retrieve hundreds, thousands, or millions of records at a time.
In special rare types of data warehouse for example, data warehouses that track workflow fact tables for event-handling processes may not have any numerical attributes. The combination of dimensions denotes an event instance. In essence, these systems typically perform value counts to return numeric results from nonnumeric data.
Dimensional and E-R Models
One popular method of creating a dimensional table schema is to start with the normalized E-R model from an existing OLTP system.
Because both design approaches are based on an RDBMS, it is reasonable to believe that the results from one approach could be used to develop the other. Let s take a look at the steps:
- An E-R diagram can be decomposed into multiple dimensional diagrams, such as Sales, Purchasing, or Customers.
- Attributes from table groups with many-to-many cardinality to one another are commonly consolidated into fact tables.
- Select relationships containing attributes that are both numeric and additive.
- The remaining E-R tables can be denormalized and designated as dimension tables using the following guidelines:
- Select tables that relate to those incorporated into fact tables.
- Resultant dimension tables should have single-part (not compound) keys.
The stars are based on discrete business processes.
Lesson Summary
There must be a dimension for each criterion that users may want to see data on in the OLAP environment. In other words, every time a users states, "We want to view this data by category/region/date/customer/shipper," there must be a representation of that criterion in the designed dimensions.
In general, avoid snowflaking of dimensional hierarchies. Snowflaking makes it more difficult for the end user to locate constraining values, and, in some cases, it can degrade query performance.
EAN: 2147483647
Pages: 114